One platform for colocation. BMS, EPMS, DCIM, CMMS, SCADA.
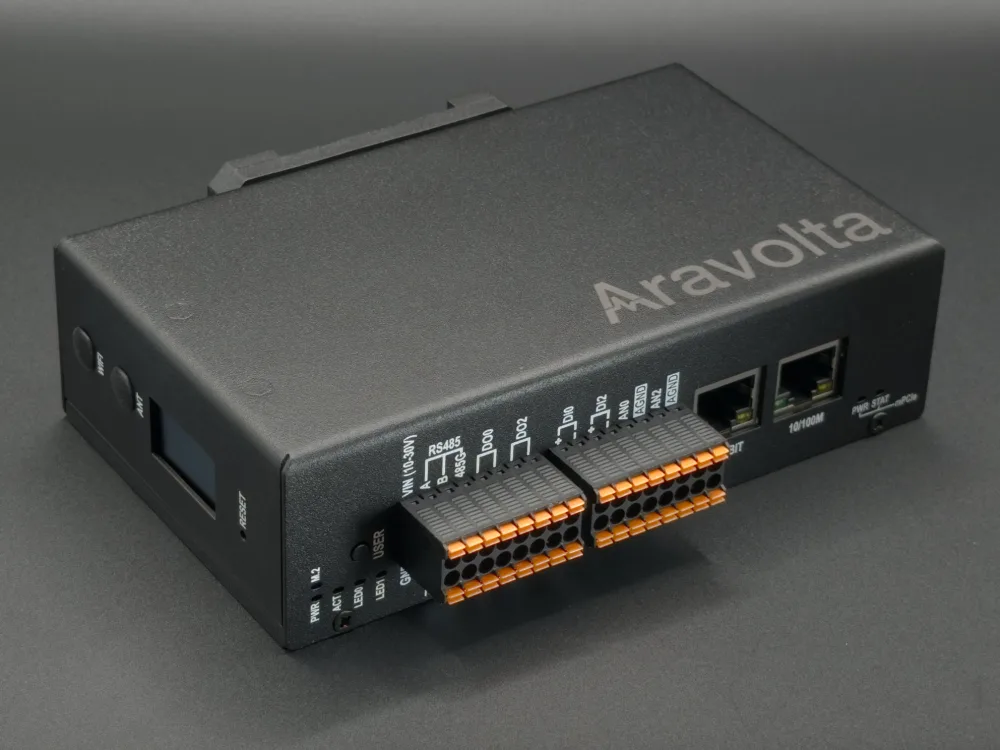
Aravolta runs alongside your BMS and EPMS or replaces them. One node on your management network reads every device and every branch circuit meter, so your NOC, your billing, and your tenants work from the same numbers. Live in about two weeks.
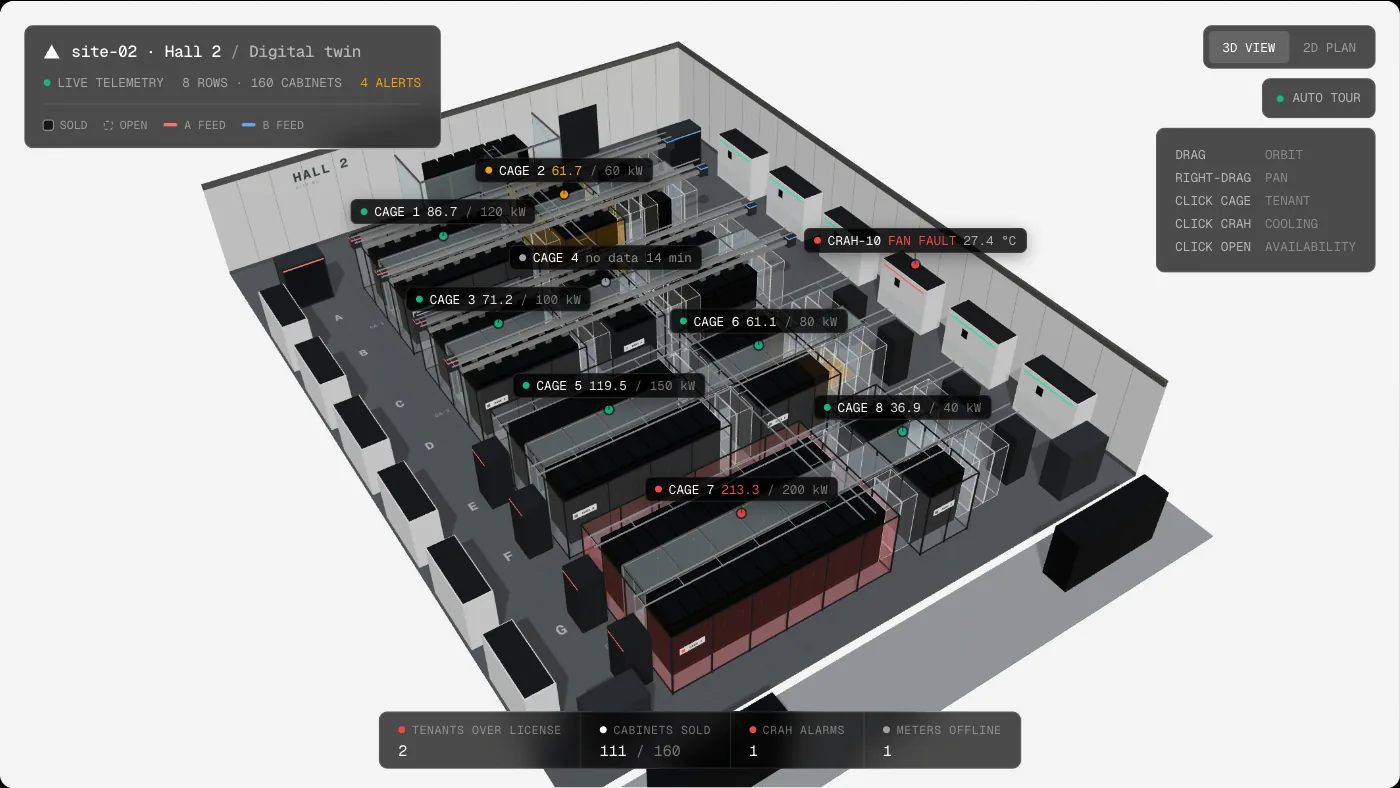
Per-cabinet power against each tenant's license, with every peak over the cap captured and logged from the same reads you bill from.
1
Read every feed
Each cabinet's A and B circuits read into the node every minute, against the tenant's license.
2
Capture the peak
When a tenant runs over, the event is logged with its start, peak, amount over, and duration.
3
Send it to billing
Export the period's power, energy, and overages for your billing system, or pull them through the API.
Tenant 14 / Power and Energy
197.50 kWnow · of 200 kW cap
99% of cap
avg 199.17 kW · peak 214.20 kWpeaks 14.20 kW over cap
Overage Events3
This period
Cabinet / Zone
Started
Ended
Peak
Over license
Duration
Cage 7
Sep 26, 13:59
Sep 26, 14:10
214.20 kW
+14.20 kW (7.1%)
11m
Cage 7
Sep 25, 21:40
Sep 25, 22:37
209.80 kW
+9.80 kW (4.9%)
57m
Cage 7
Sep 24, 16:02
Sep 24, 16:14
203.20 kW
+3.20 kW (1.6%)
12m
Power and energy workbook
Sample data. We map your tap boxes, panel circuits, and contract terms at onboarding.
In the product
What your team opens every day
Branch circuit monitoring, an assistant that answers from live data, a network map drawn from the switches themselves, and AI vision on the cameras you already have.
Most popular
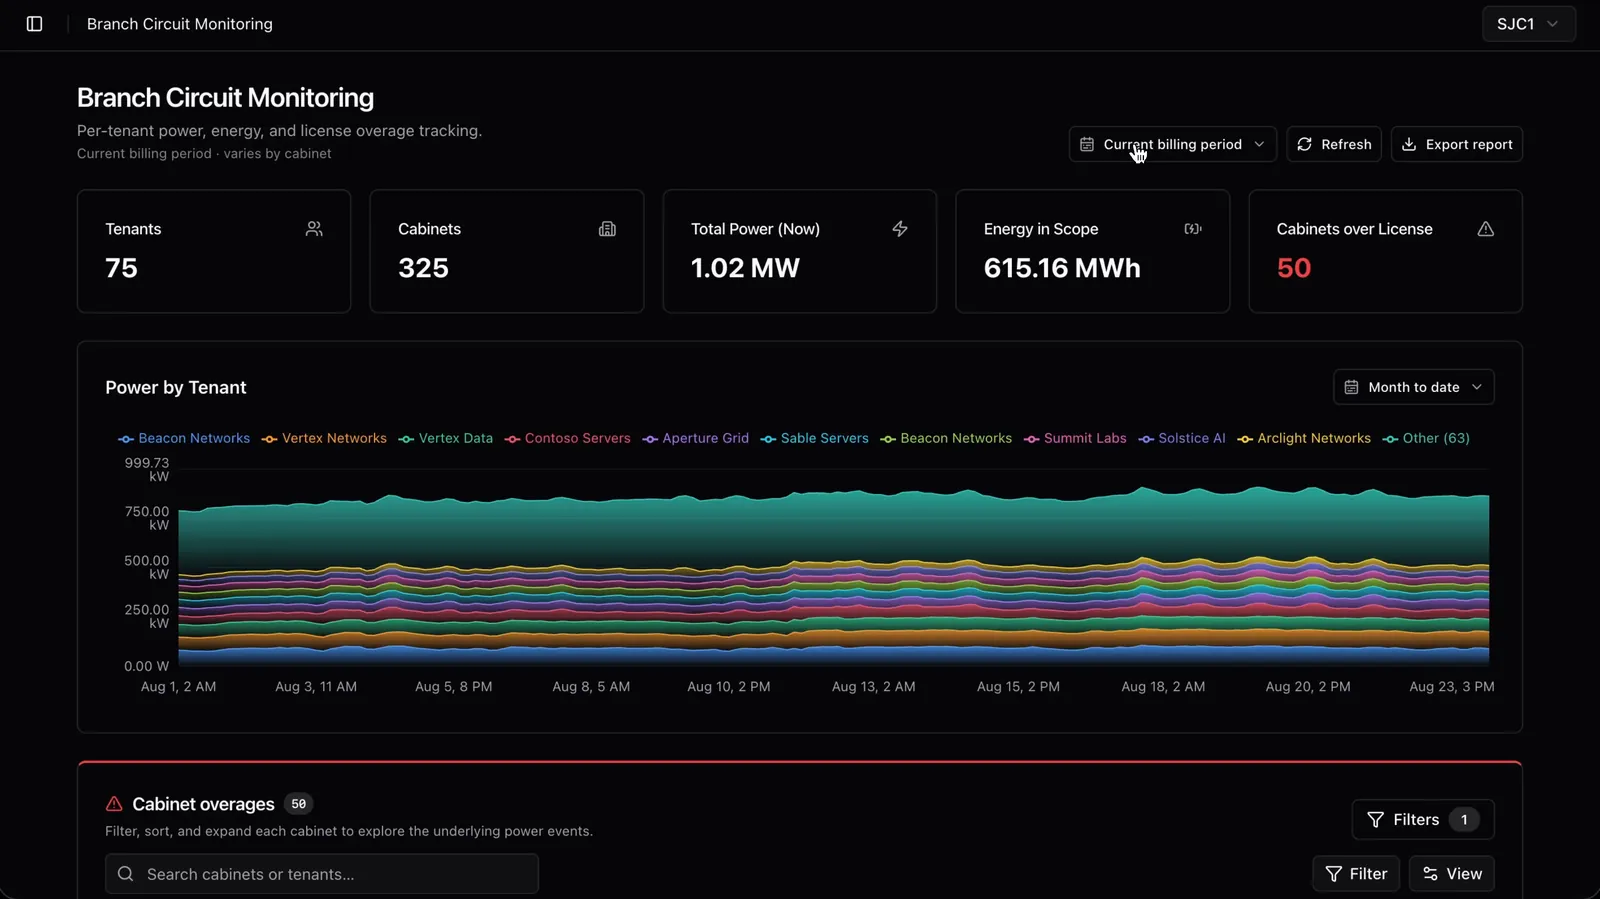
Branch circuit monitoring
Every circuit in the building is read continuously and mapped to the tenant on it. An overage shows up the moment it happens, and the invoice comes out of the API instead of a spreadsheet.
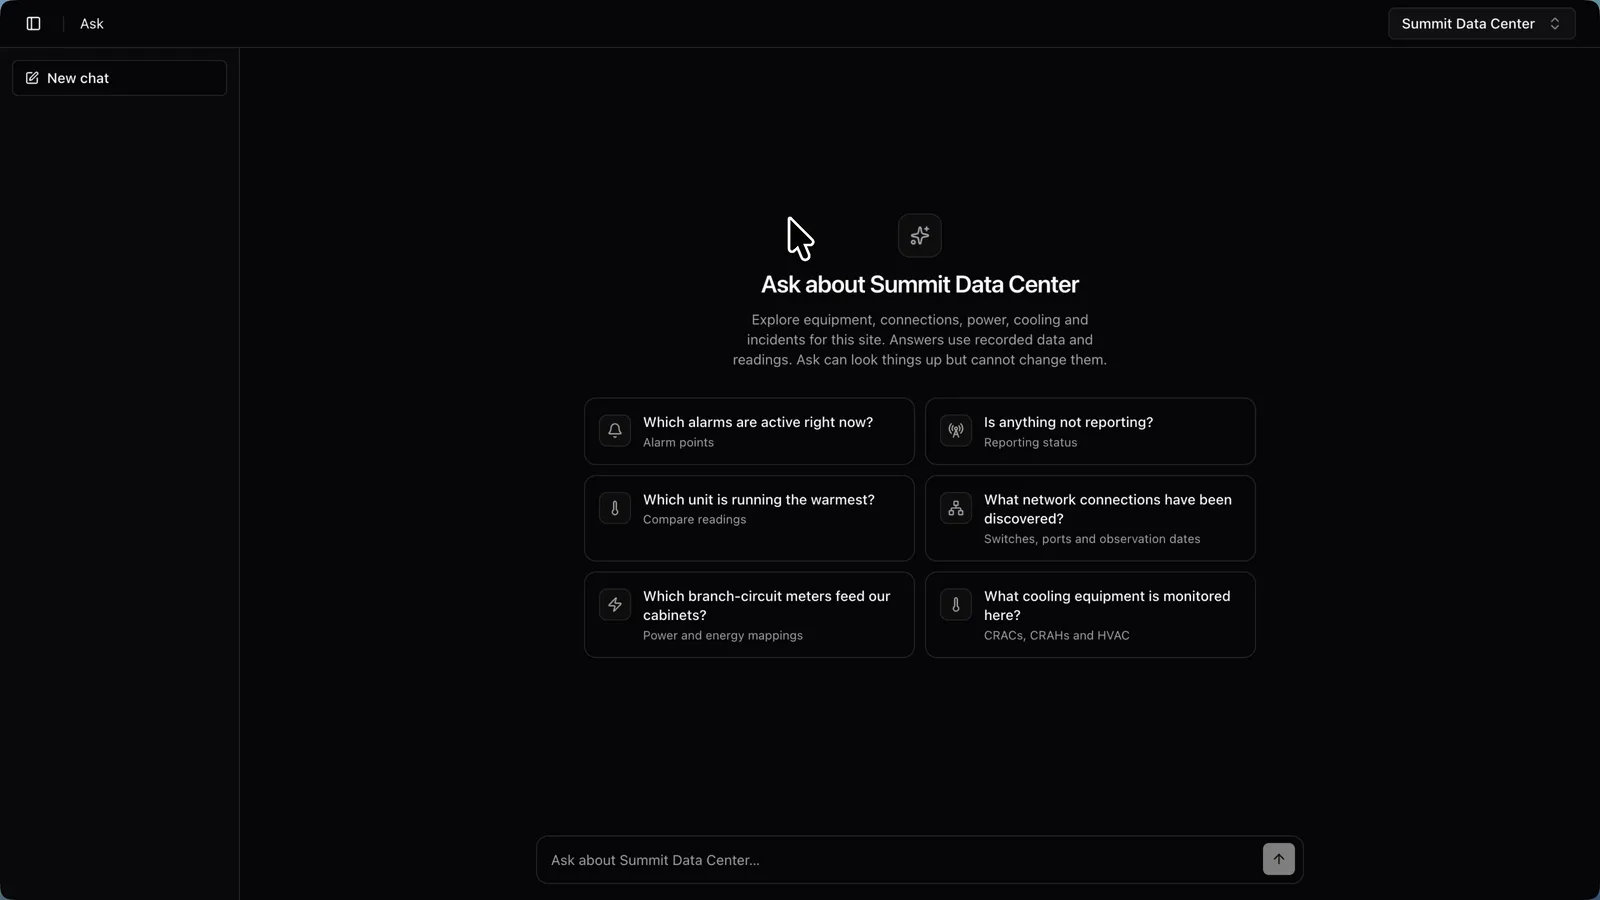
Ask a question in plain language and get an answer built from live readings, incident history, and asset records across every site. Nobody digs through dashboards to find out what changed.
Answers built from live telemetry
Cites the assets and readings behind every answer
Scoped to what each user is allowed to see
Network
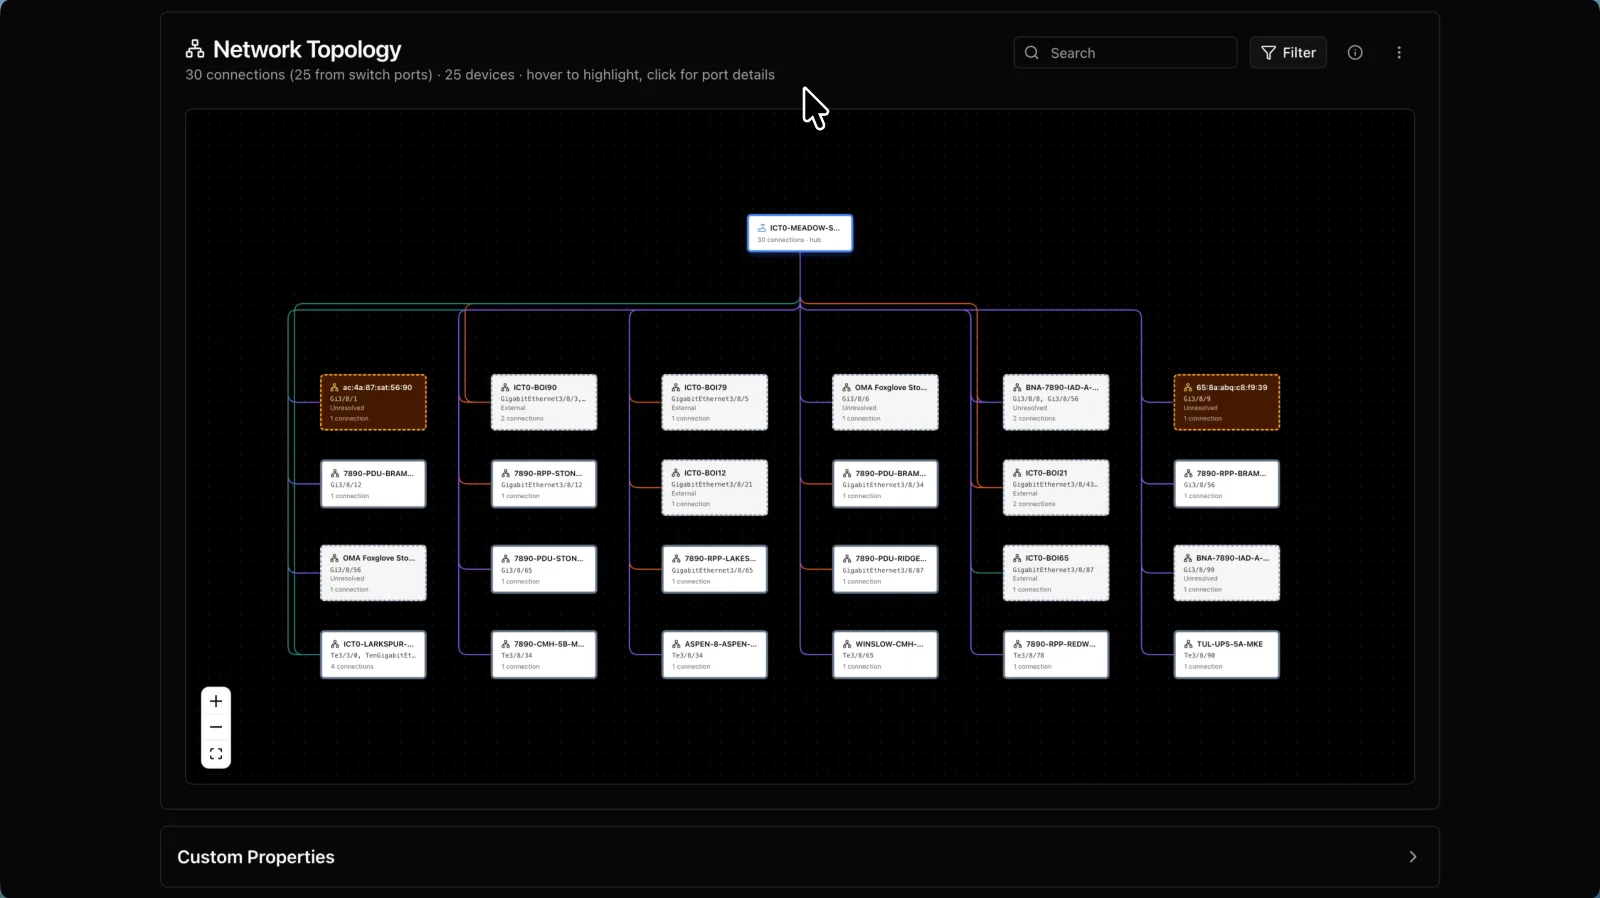
Network topology
Open any switch and see what is on the other end of every port. Aravolta draws the graph from LLDP neighbor advertisements and the switch's own forwarding table, so devices that never advertise themselves still appear, resolved to a MAC, IP, and VLAN.
Discovered from LLDP and MAC forwarding tables
Every port resolved to a device, IP, and VLAN
Agentless, with nothing installed on your switches
1,920 px of motion · 10 s before the trigger keptSent to on-call engineer
Cameras
AI vision on the cameras you already have
You do not need new cameras. Aravolta reads your existing CCTV streams and runs motion and object detection server side.
Any camera, dumb or smart
Motion zones and pre-event footage
Events go into your existing alert system
One node, every device
Know what is actually in the building
The node sits on your management network, with no agents and no middleware. It sweeps the network, fingerprints every device it finds, and hands back live data instead of a PDF report, built for brownfield sites where the asset list went missing years ago.
Node · in your facility
Your dashboards & toolsone live feed
REST API
Alerts & control
ModbusBranch circuit meters, PDUs, RPPs
BACnetCRAHs, CRACs, chillers
SNMPUPS, ATS, rack PDUs
Redfish / IPMIServers and BMCs
MQTTIoT sensors
Wired I/ODry contacts, RS-485
↓ into your Aravolta node
Node · in your facility
↓ one live feed
Your dashboards & tools
REST APIAlerts & control
One sweep
Every device on the network, with its make, model, serial, MAC, firmware, and manufacture date.
46,000+ profiles
Each device is matched against the library, so it is identified, not guessed at.
Firmware checks
Known CVEs and devices past the end of vendor support are flagged.
New device types
A device type we have not seen before is onboarded within 48 hours.
Tenant portal
Prebuilt tenant dashboards
Every tenant gets a dashboard out of the box: live draw against their license, kWh consumed, and every peak over cap. You decide what each one sees.
Share upstream assets per metric: the UPS feed serving a tenant, yes. The rest of your plant, no.
Their billing model, cabinets, and renewal date in one place.
Read only, scoped per tenant, and revocable at any time.
Tenant 14
General information
Tenant name
Tenant 14
Status
Active
Billing model
Licensed
Power license
200 kW
Cabinets
24 assigned, Cage 7
Renewal cadence
Monthly
Power and energyLast week
Average power
194.32 kW
kWh consumed
32,646.38 kWh
197.40 kWnow, of 200 kW cap
99% of cap
avg 194.32 kW · peak 214.20 kWpeaks 14.20 kW over cap
Sample data. What Tenant 14 sees when they sign in.
Send the asset list, make and models, and credentials. The node goes on the management network, scans the subnet, and imports what it finds. Most sites are live in about two weeks.