GPU Asset Financing on Per-Asset Telemetry
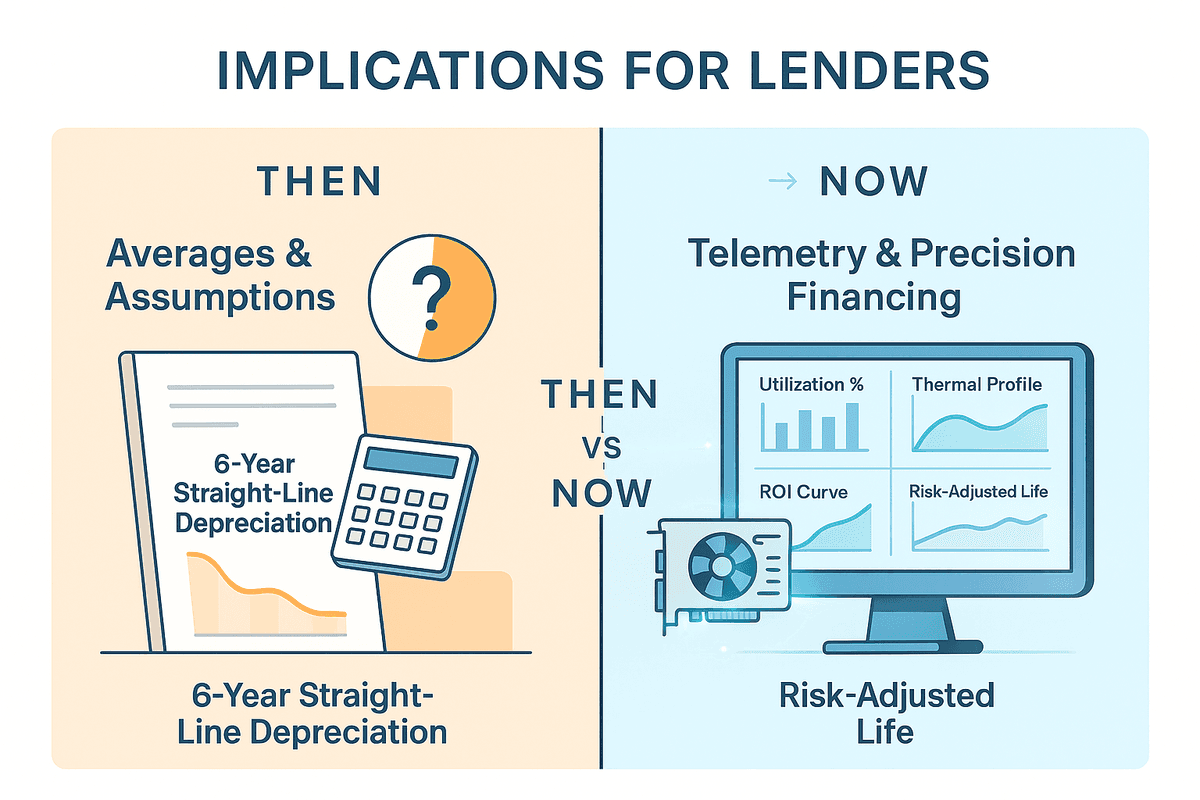
A GPU that lasts 6 years and one that lasts 3 can be the same part number. The difference is workload. Aravolta records utilization, temperature, and power for every financed device, so the underwriting rests on that record instead of an industry average.
The $50M question
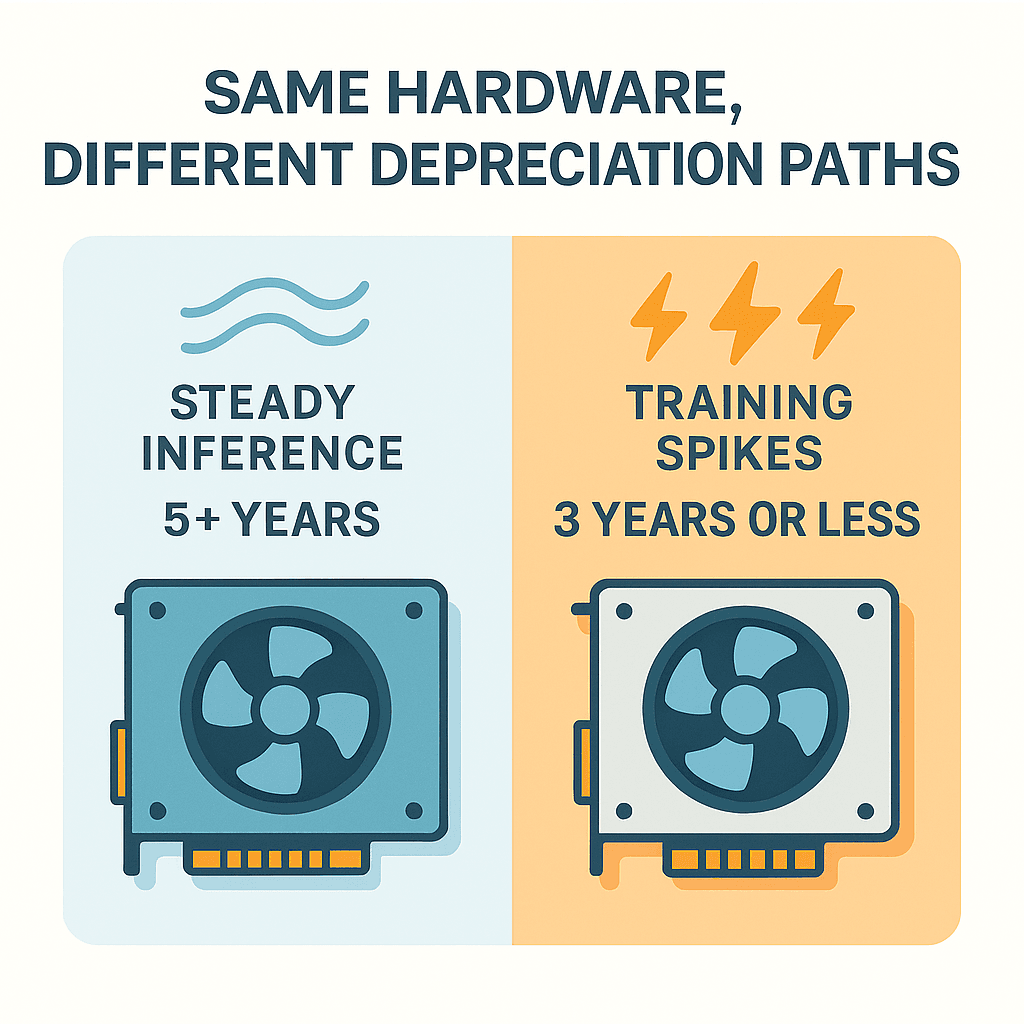
Most GPU financing assumes one depreciation curve for the whole portfolio. Two identical H100s can age at very different rates depending on how they are run:
Training workloads at 95%+ utilization
3 years or less of economic life
Steady inference at 60 to 70% utilization
5+ years of service
Without per-asset data, both get the same terms. That is mispriced risk.
What the telemetry gives an underwriter
Per-asset data on the collateral, from deployment through retirement
Per-asset monitoring
Utilization, temperature, power draw, and workload pattern for every GPU in the portfolio, read from the hardware while it runs.
Depreciation curves per asset
A depreciation model for each asset, built from its measured usage, thermal stress, and maintenance record rather than an industry average.
Early warning
An alert fires when an asset exceeds its thermal limit, throws unusual power spikes, or settles into a pattern that shortens its life. You find out before the next covenant review.
Performance-based structures
Usage-based payments, performance triggers, and maintenance escrows tied to the measured condition of the assets. Each term references a number the lender can verify.
Financing structures we support
Sale-leasebacks with performance triggers
Lease terms that move with measured utilization and thermal performance. If the telemetry shows the assets are being overworked, a maintenance reserve or early buyback clause triggers on its own.
Example: a 5-year sale-leaseback with a quarterly payment adjustment based on average GPU utilization and thermal violations, as recorded by Aravolta
Usage-based credit lines
Revolving facilities where capacity and rate are tied to measured GPU-hours. Payments follow verified compute output rather than an estimate from the borrower.
Example: a credit line where the rate steps down for operators that keep GPUs at 60 to 75% utilization, and holds for those that run the hardware flat out
Portfolio risk monitoring
For lenders holding several GPU-backed loans: asset performance, utilization variance, and depreciation trend, rolled up across every deal.
Example: a dashboard that shows which borrowers run their GPUs hot and which run them conservatively, with the projected salvage value adjustment for each
What better data is worth
Take a $50M GPU financing portfolio. If the telemetry shows the assets will last 3.7 years instead of the assumed 5.5, salvage value drops about 30%. That is $15M+ in adjusted risk pricing.
Lower risk exposure than underwriting without asset data
To bring the assets of a new deal under monitoring
Asset performance data, per device