
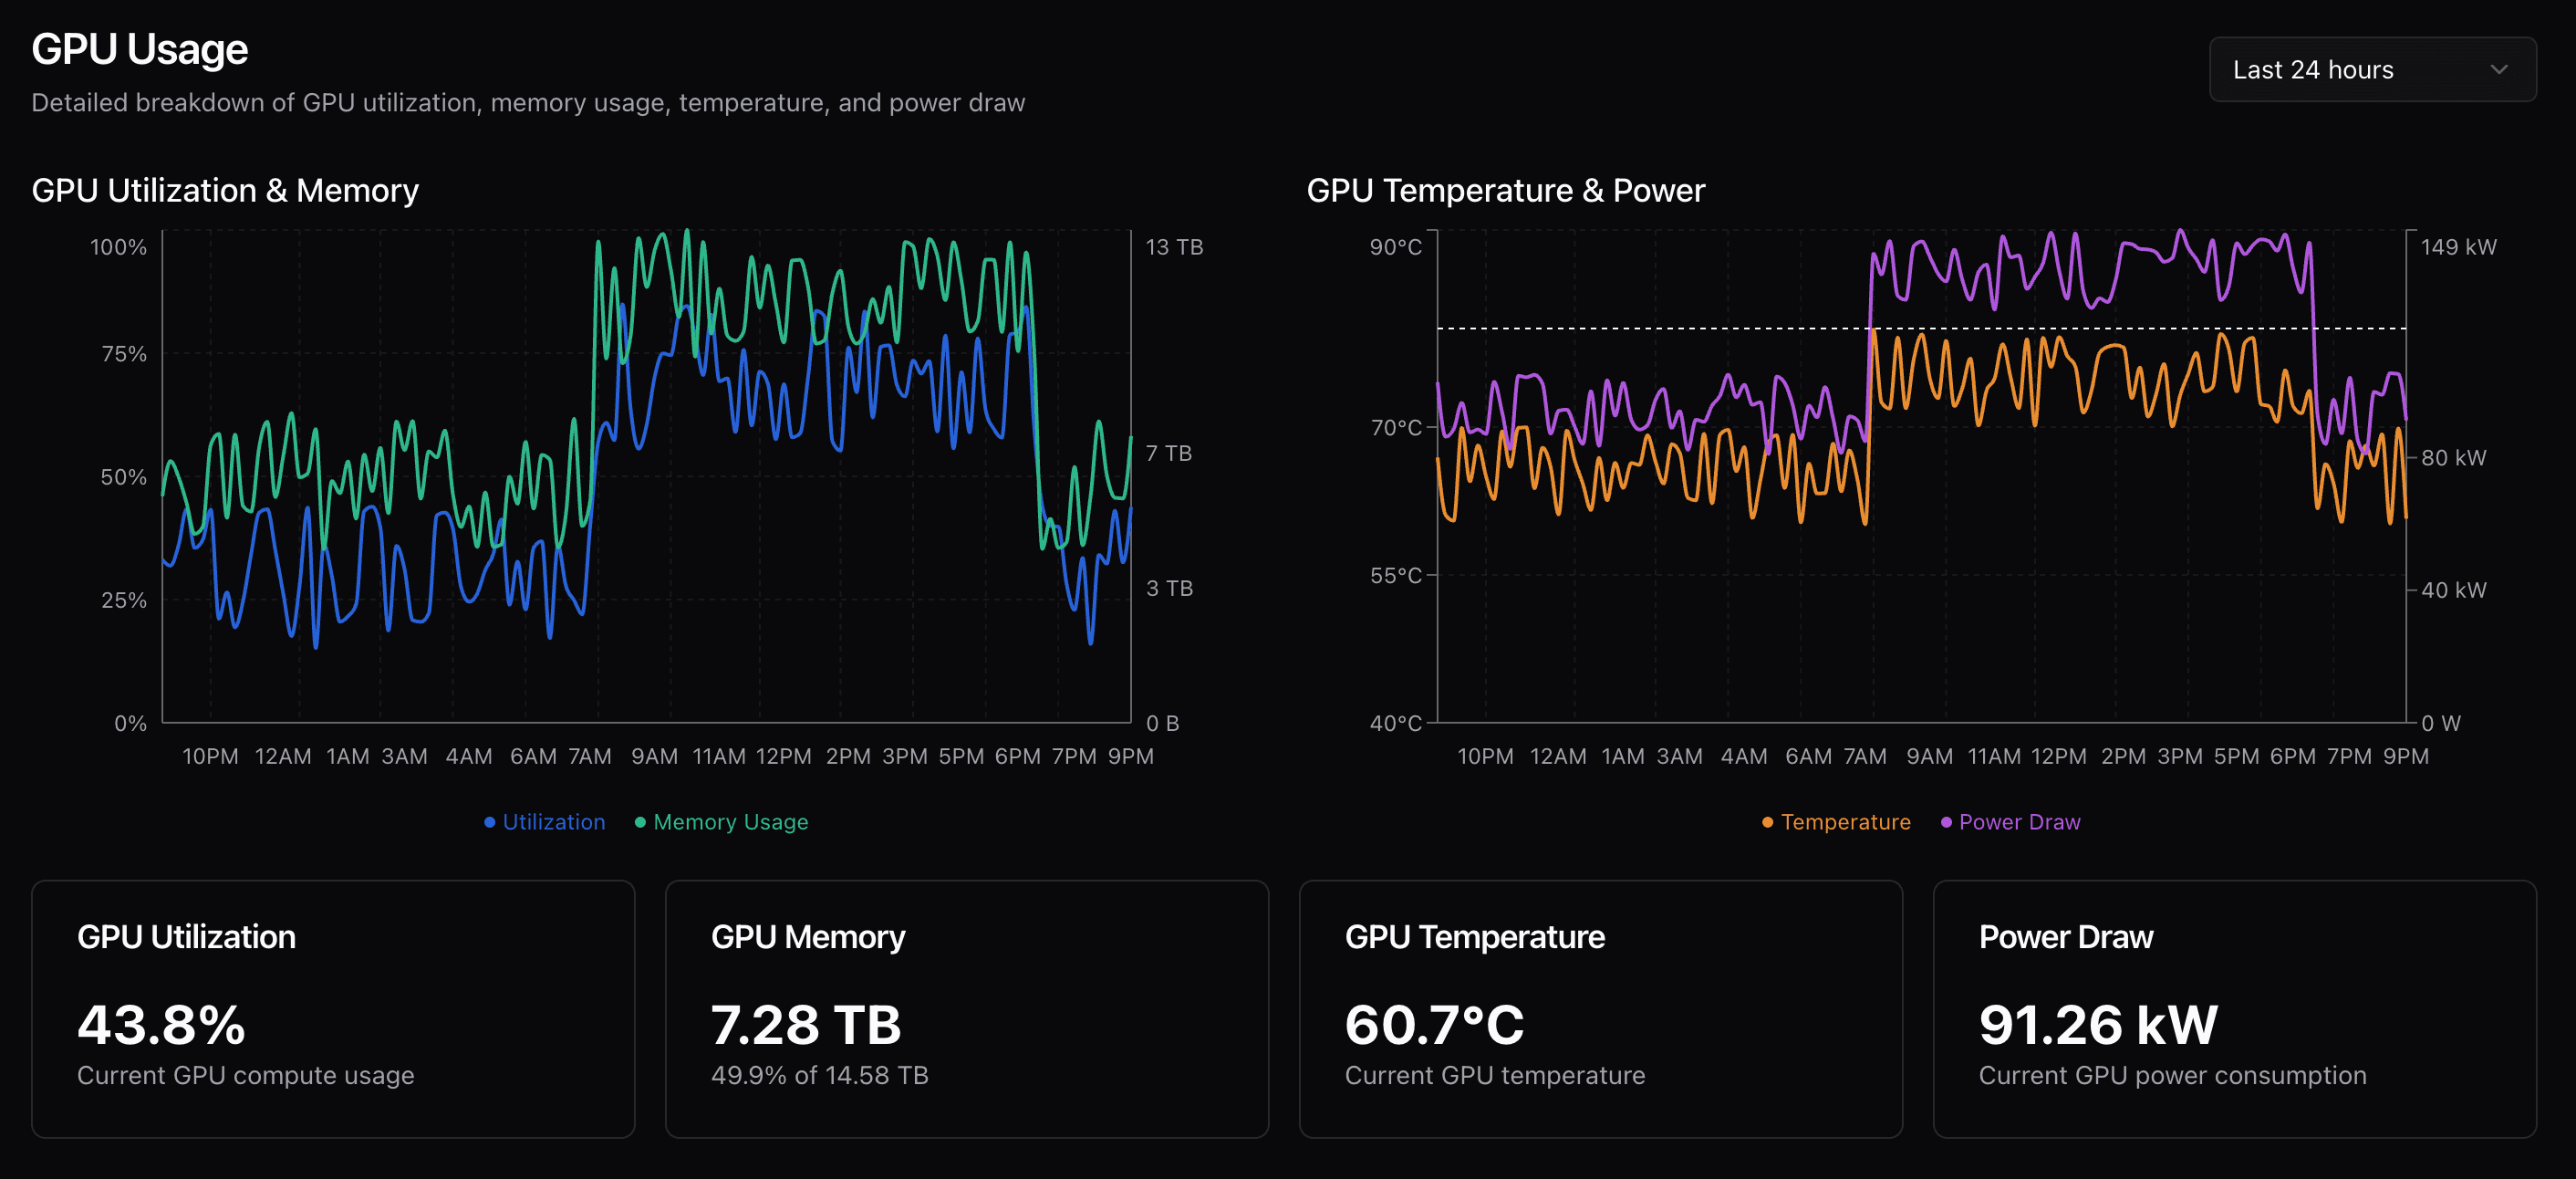
GPU utilization, temperature, power draw, and memory use, per device, across the portfolio
What goes into the underwriting
Utilization pattern
Measured GPU compute load over time. Steady 60 to 70% utilization points to a longer asset life than a constant 95%+ training load.
- • Average utilization
- • How often it peaks
- • Workload variance
Thermal behavior
Temperature trend and thermal limit violations. The usual rule of thumb: every 10°C rise in operating temperature roughly halves component life.
- • Average operating temperature
- • Thermal limit violations
- • Cooling performance trend
Stress events
Power spikes, thermal cycling, and other events that age a GPU faster and shorten its economic life.
- • Power spike frequency
- • Thermal cycling pattern
- • Maintenance events
Worked example
A $50M portfolio: averages vs. reality
Underwriting on averages
- ✗ 5.5-year useful life assumed for every GPU
- ✗ 80% steady utilization assumed across the portfolio
- ✗ No variance by customer or workload
- ✗ Salvage value overstated by 30 to 45%
What the telemetry showed
- ✓ Actual life ranged from 3.7 to 6+ years
- ✓ Utilization ranged from 40 to 98% by customer
- ✓ Depreciation curves varied by 30 to 45%
- ✓ Salvage value projected per asset
Result: $15M+ in adjusted risk pricing, based on measured asset performance