The BMS built for data centers.
Everything built in.
Cooling, power, security, and control, all on one node and in one database. Built for data centers from the start, not a general building system stretched to fit. It runs alongside the BMS you have, or replaces it.
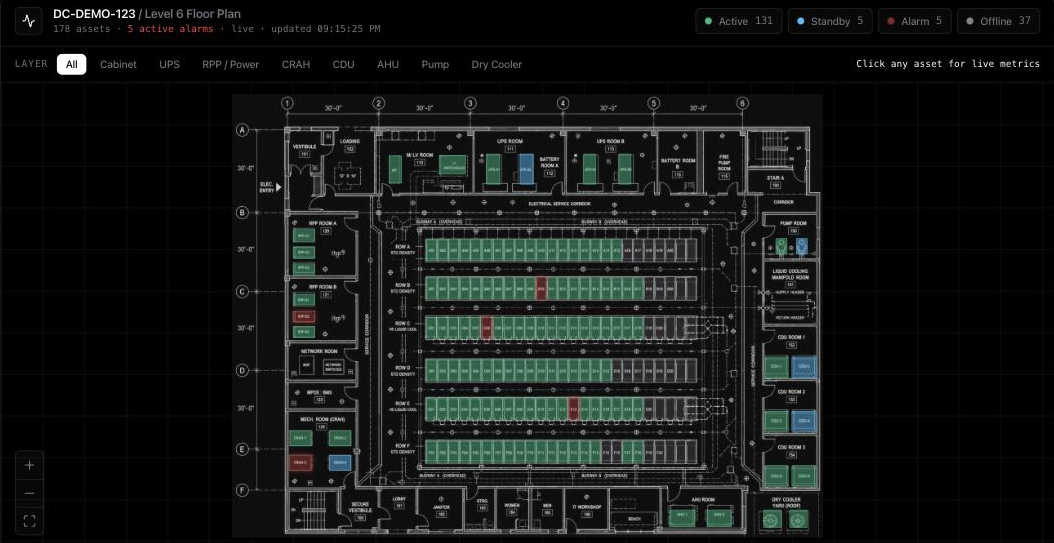
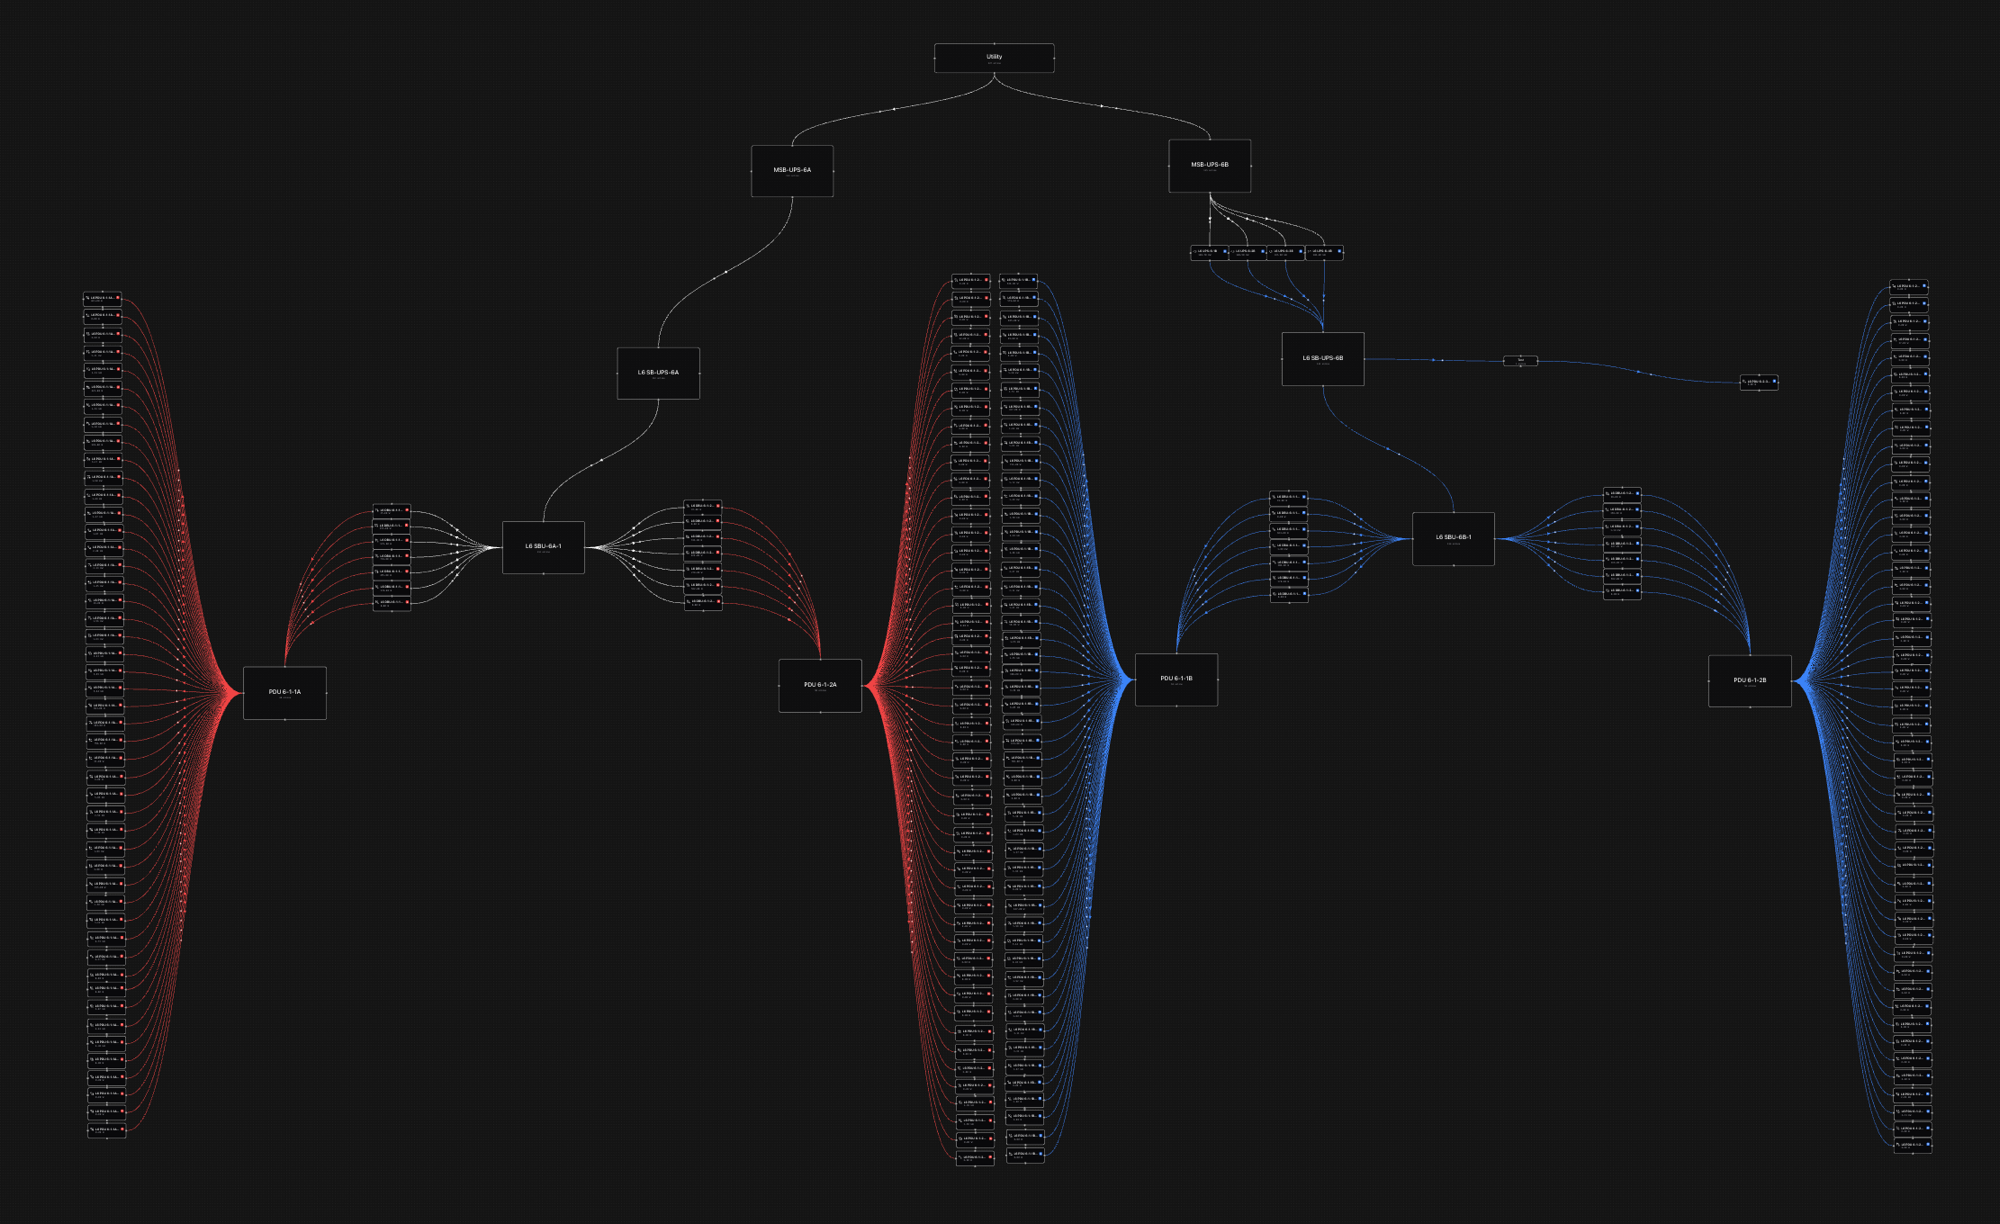
One node reads every cabinet, UPS, RPP, CRAH, CDU, and pump on this floor into one database. Click any asset for its live metrics.
Request DemoBuilt in, not bolted together
The usual data center stack is a building system from one vendor, a power platform from another, a camera system from a third, and a DCIM tool on top, wired together by an integrator over six to twelve months. The building system and the power platform are almost always two separate products, because a general building system was never built to capture power quality on its own. You pay an integrator to make them talk, and you own the seams between them.
Aravolta is one node and one database. Cooling, power, power quality, cameras, and control come from the same system, so a chiller trip, the racks it feeds, and the tenant on those racks are already on one screen. There is nothing to integrate.
- BMS from one vendor
- EPMS / power platform from another
- Cameras and access from a third
- DCIM tool on top
- One node on the network
- One database for the whole facility
- One view, one alerting layer
- One REST API over all of it
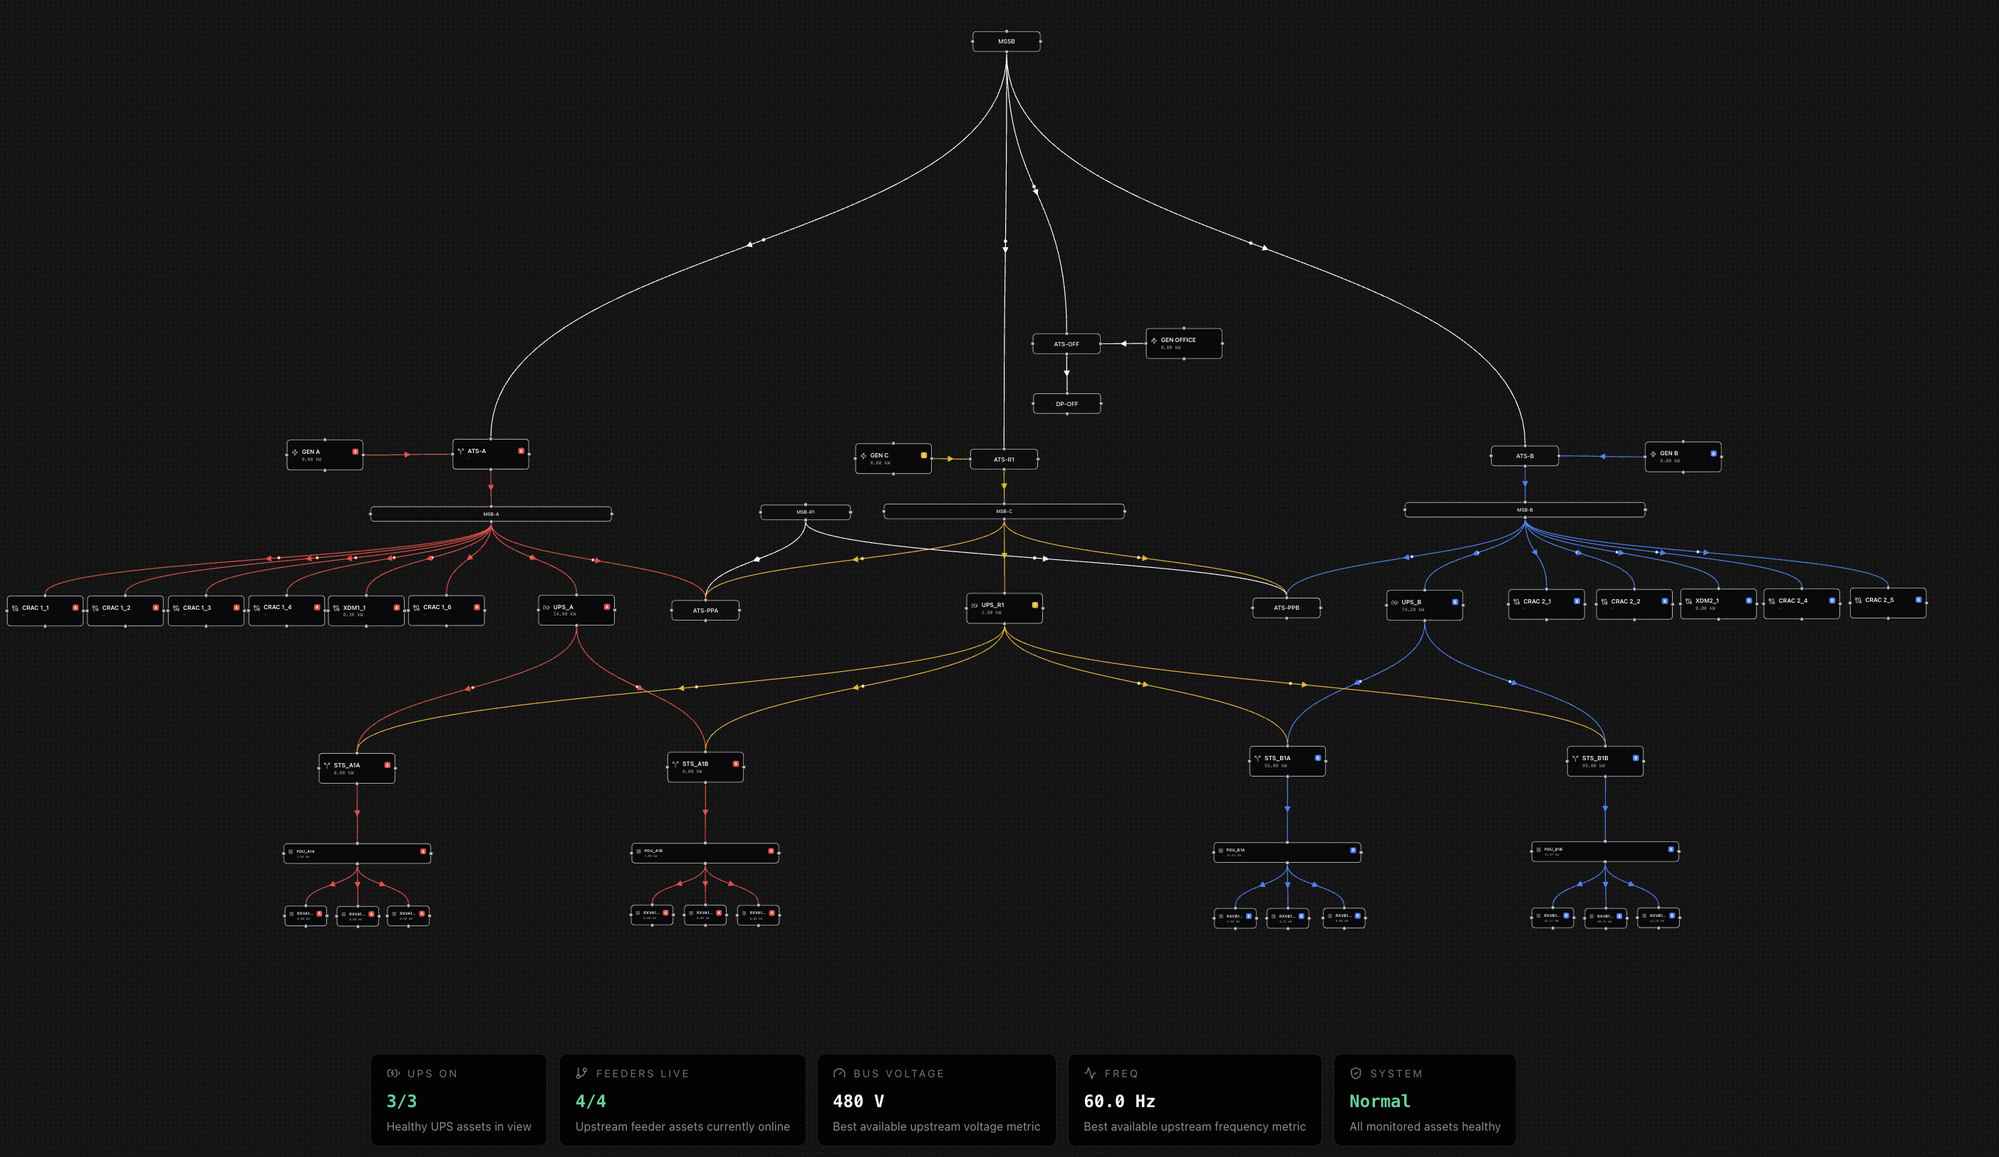
Trace power to the rack
Every device knows its parents, so you can trace power from the utility feed through the switchgear, UPS, and RPP down to a single rack, and see which racks go dark if a breaker upstream trips. Drift detection flags a path that cannot be real, like a cabinet pulling more than its breaker can deliver.
The one-line is a living model of your power chain, not a PDF drawn once and filed away. It maps to the devices we discover, so every load and breaker on it moves with the real plant instead of drifting out of date.
Not just monitoring. Control.
Reading the plant is half of it. Aravolta acts on it too. Let your existing PLCs and DDCs keep the critical interlocks, the lead/lag on a pair of CRACs and the safety trips. Aravolta takes the micro-adjustments that move the energy bill. It trims setpoints against outside air and the sensors across the hall, instead of overcooling every rack to the worst case.
On greenfield builds it is the whole control layer, with its own PLC. Whether it runs next to the incumbent or in its place, control changes are permissioned and logged. Not every login gets to move a setpoint.
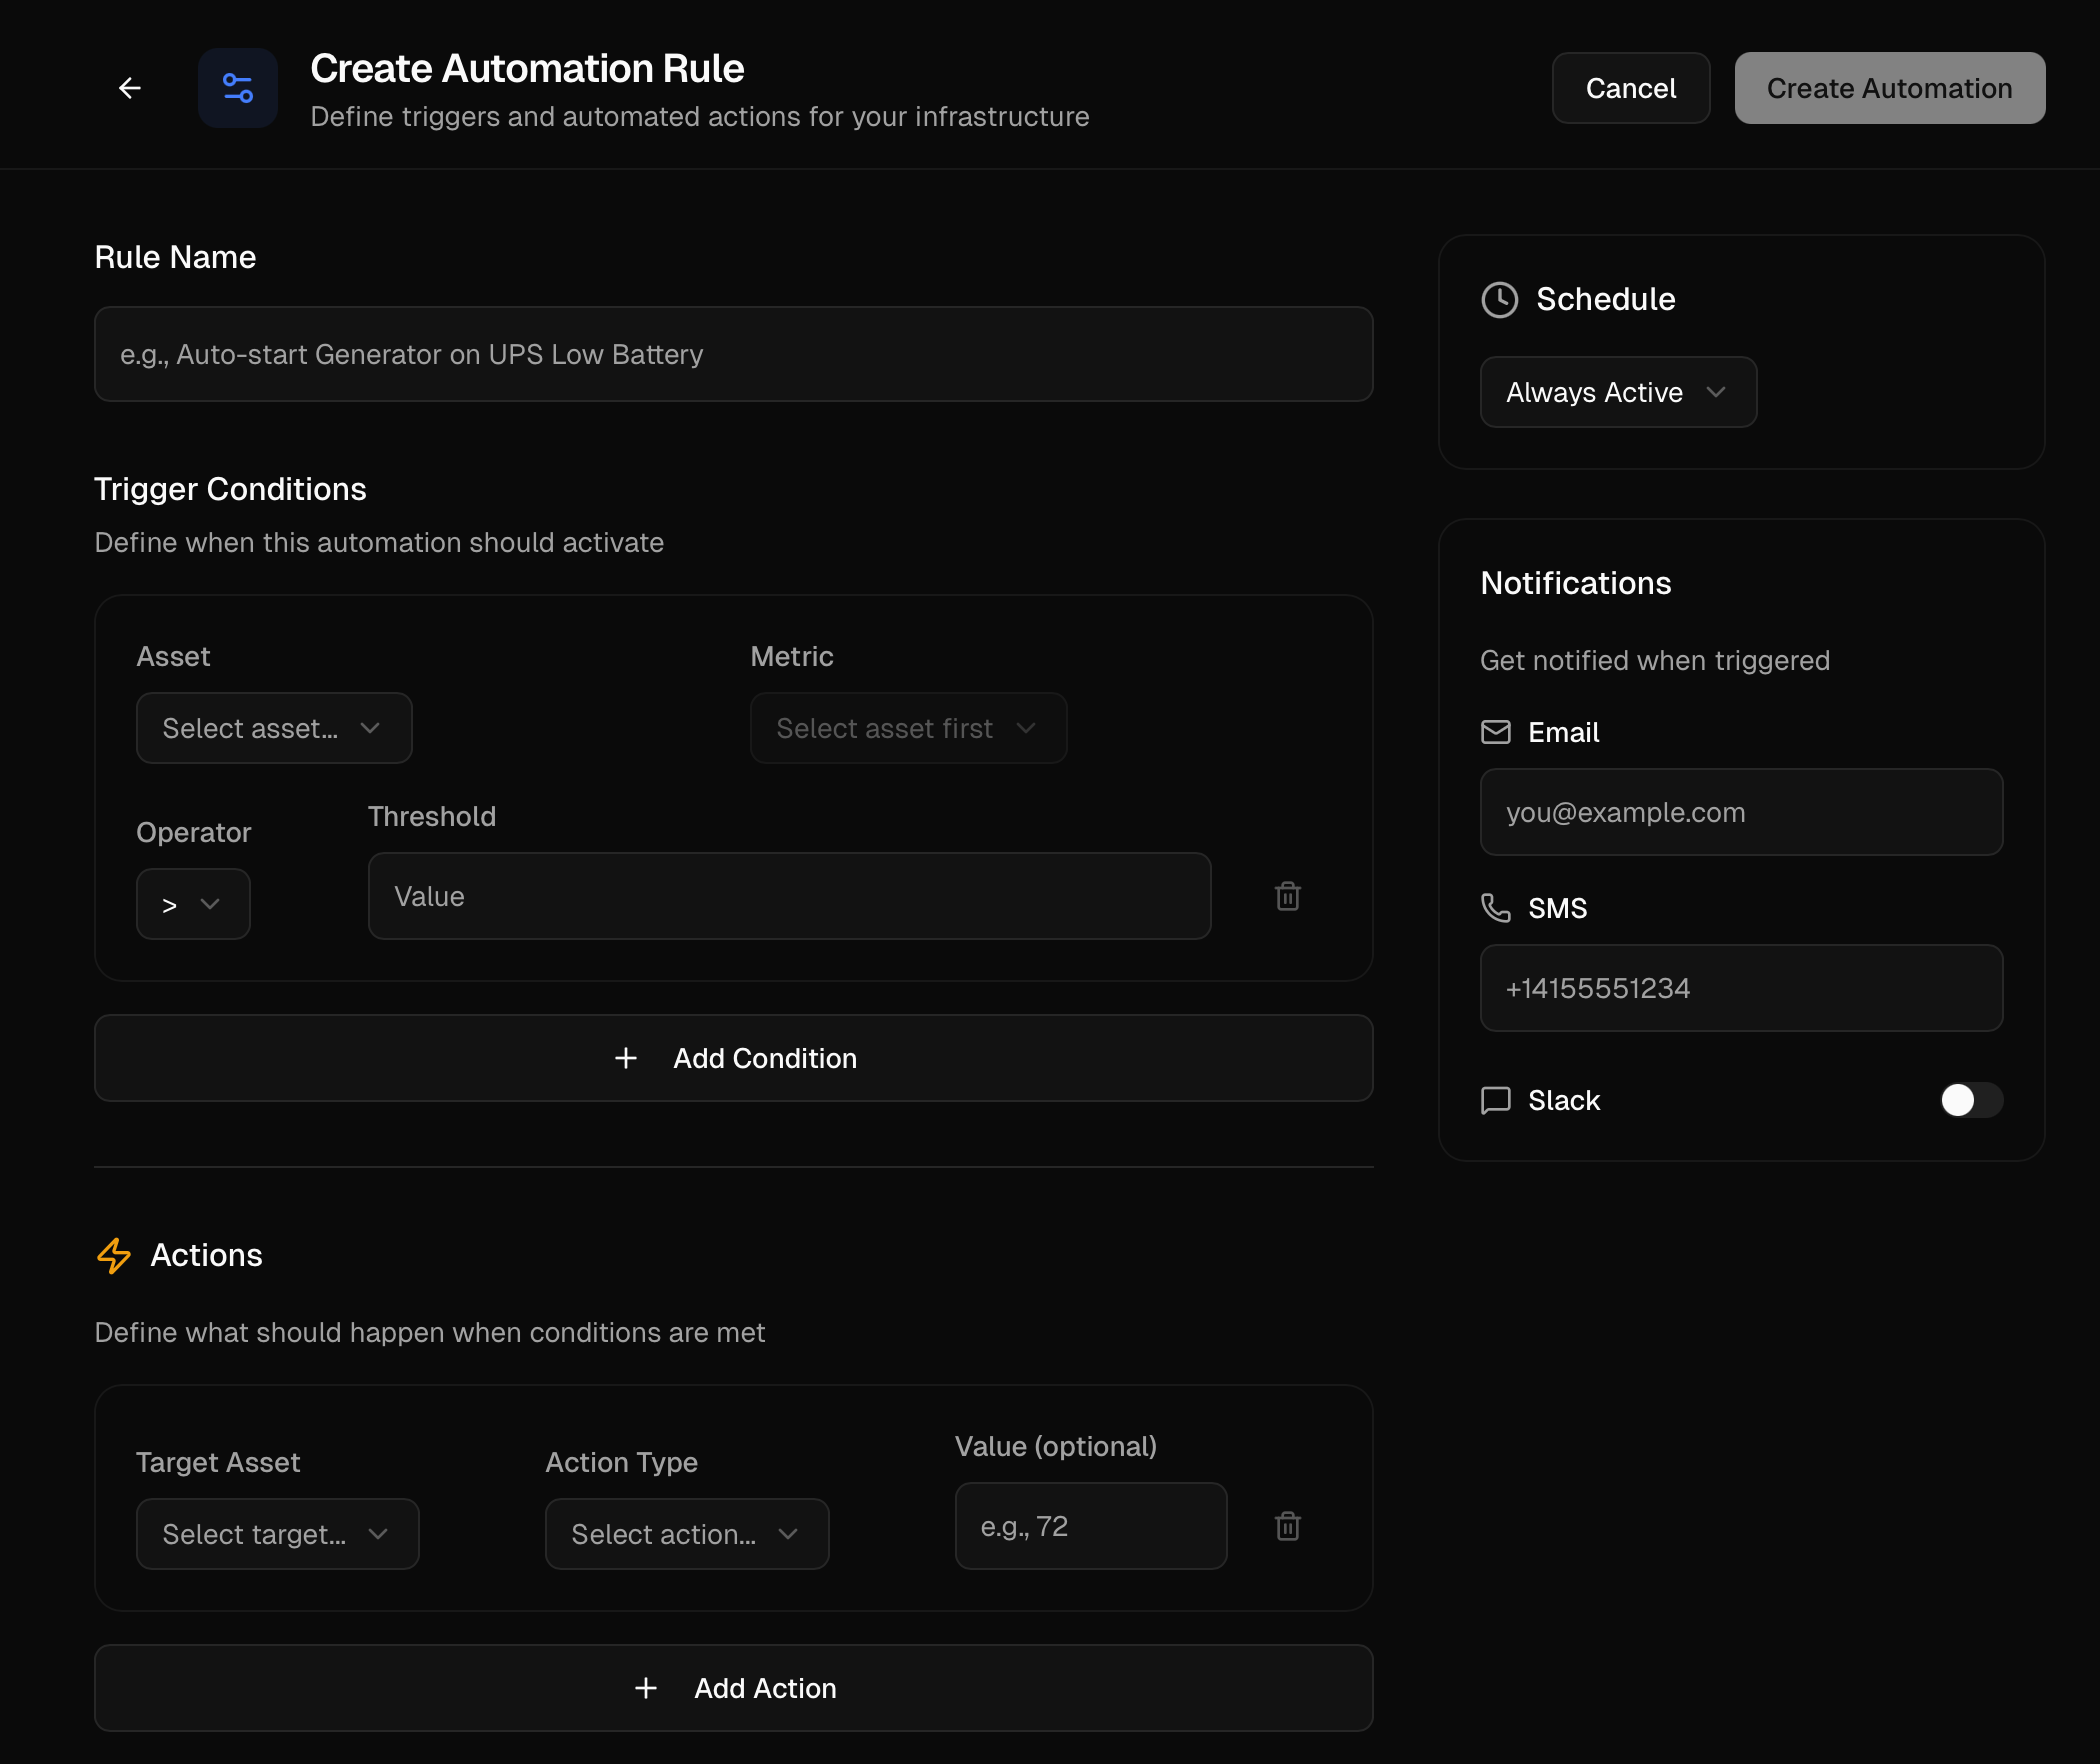
Chain conditions across power and cooling into one action, like starting the generator when a PDU and its upstream UPS both read zero.
Know your real headroom
Nameplate ratings are conservative and everyone knows it, but few operators can prove how much room is actually left. Aravolta reads the live load at every breaker in the hierarchy, shows the real headroom, and simulates a breaker loss so you can see what fails over and what does not.
Operators use it to run tighter, some past 120 percent of the old rated limit, without flying blind. See capacity planning on the EPMS page.
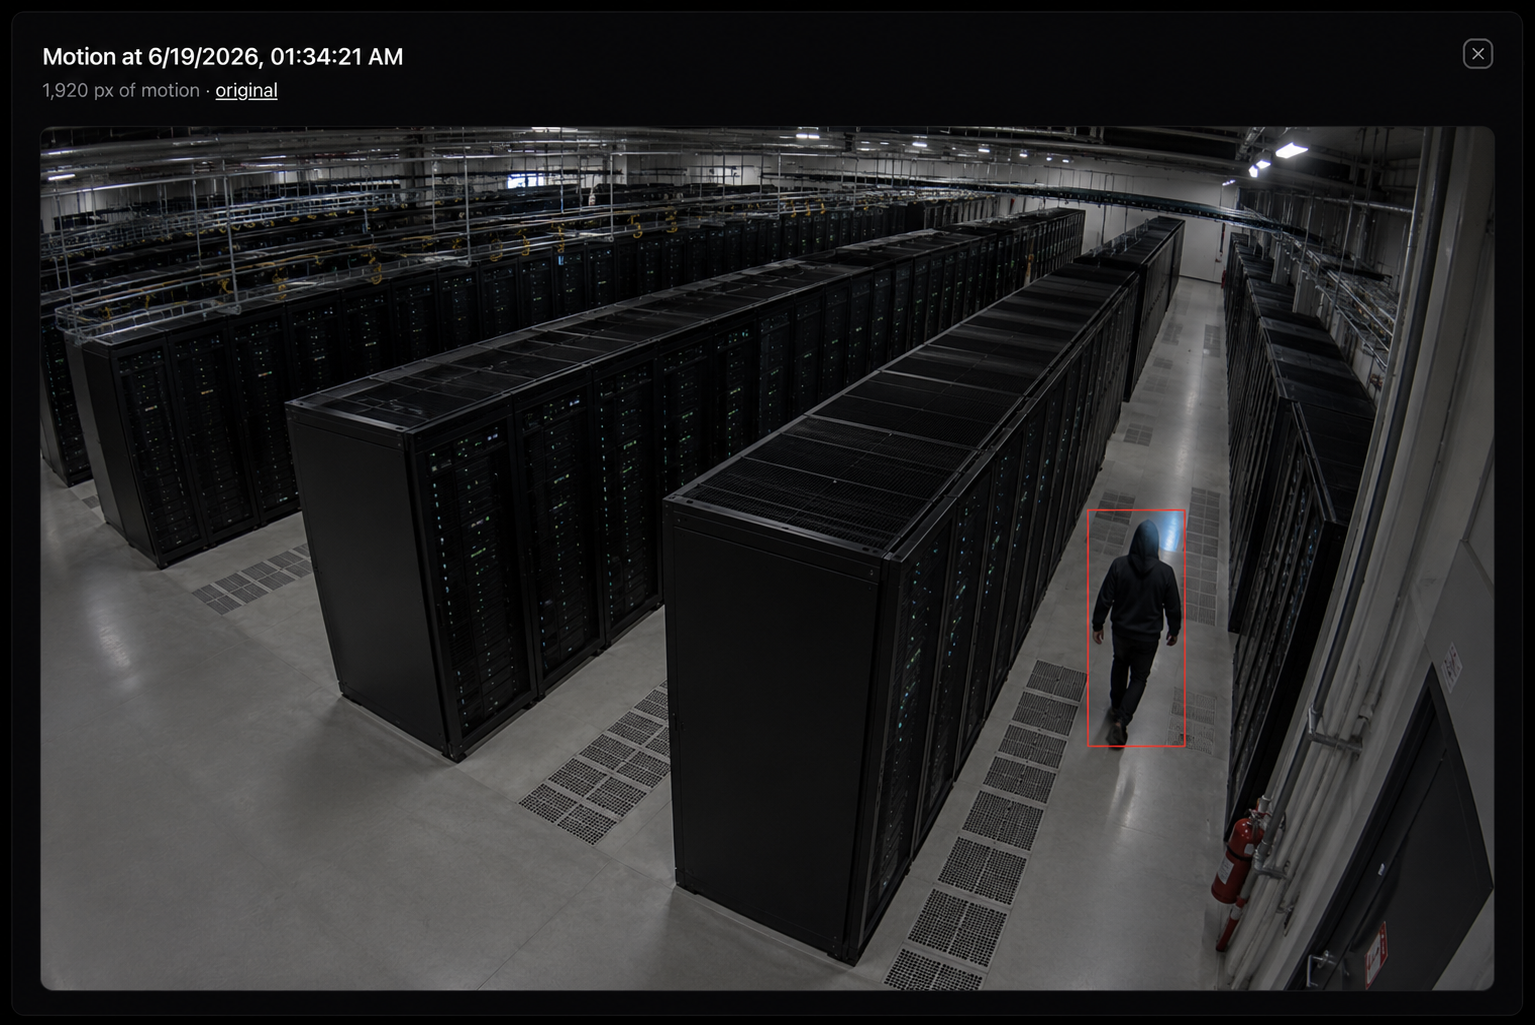
Security on the same map
Cameras and access control are not a separate system you log into. Aravolta pulls any camera that speaks RTSP, with PTZ control, and puts the feed on the same floor plan as the cooling and the power. Motion in a cold aisle at 2am becomes an alert instead of a clip nobody watches.
Access control comes in the same way. Badge and biometric readers, door locks, and entry logs, tied to the room and the rack they protect. A forced door and the camera above it are one event, on one map.
How it starts
Send the list
Asset list, make and models, credentials. That is the whole intake. Send your engineering drawings, CAD, or single-line files too, and the floor plan and one-lines build from them.
Plug in the node
One node per site on the management network. It scans the subnet and imports every device. Known gear comes online instantly. A new device type takes about 48 hours, at no cost.
Work from one view
Dashboards, floor plans, and live one-lines are built from your files during onboarding. After that it is self-service: add an asset, a view, or a threshold yourself, with no change order and no wait on a BMS vendor. Every point is on the REST API; alerts go to Slack, email, or SMS.
The first weeks usually pay for the install: CRAC fans running faster than the load needs, halls a couple of degrees overcooled, circuits that were never billed.
What it connects to
The whole building, not just the mechanical plant. Cooling, power, life safety, and security, each polled live over its own protocol.
Every protocol in. One live feed out.
Each device speaks its native protocol to the node. You get one normalized feed.
Non-networked gear doesn't get left behind
Gensets, fire panels, cooling towers, and plenty of sensors were never built to sit on a network. They speak serial, dry contact, or a raw analog signal, and the node takes those inputs directly. That gear lands in the same view as everything on the LAN, with no gateway or protocol converter in between.
It works the same on a brownfield retrofit or a mixed-vendor floor. If a device puts out a signal, it goes in the database.
It sees everything, and fits your datacenter
Aravolta is one layer over cooling, power, and security, so a chiller trip shows its power impact, the affected racks, and the tenant exposure on the same screen. Run it alongside the BMS you already have, or install the full stack on a greenfield build.
It talks to each device in its own protocol, not to another head end, so the data lines up on its own and nothing on your screen goes dark when an old system does.
- Run it in our cloud, in your cloud, on-prem, or fully airgapped, so data can stay inside the building.
- For networked gear the node runs as a VM on your own hardware, with no agent on the devices it reads. Serial and analog gear wires straight into the appliance.
- Single-tenant, and configured to your datacenter, from network segments and access rules to your change process.
- Your data is yours and exportable over the API. SOC 2 Type I and II, independently audited.
Frequently asked questions
See the whole plant in one view
Send the asset list. We ship a node. Live cooling, power, and environmental data in about two weeks.