
Every watt, every breaker, every second.
Interactive one-line diagrams, branch circuit monitoring, breaker tracking, and metered billing. Utility intake to individual outlet, sub-second polling, every meter in between.
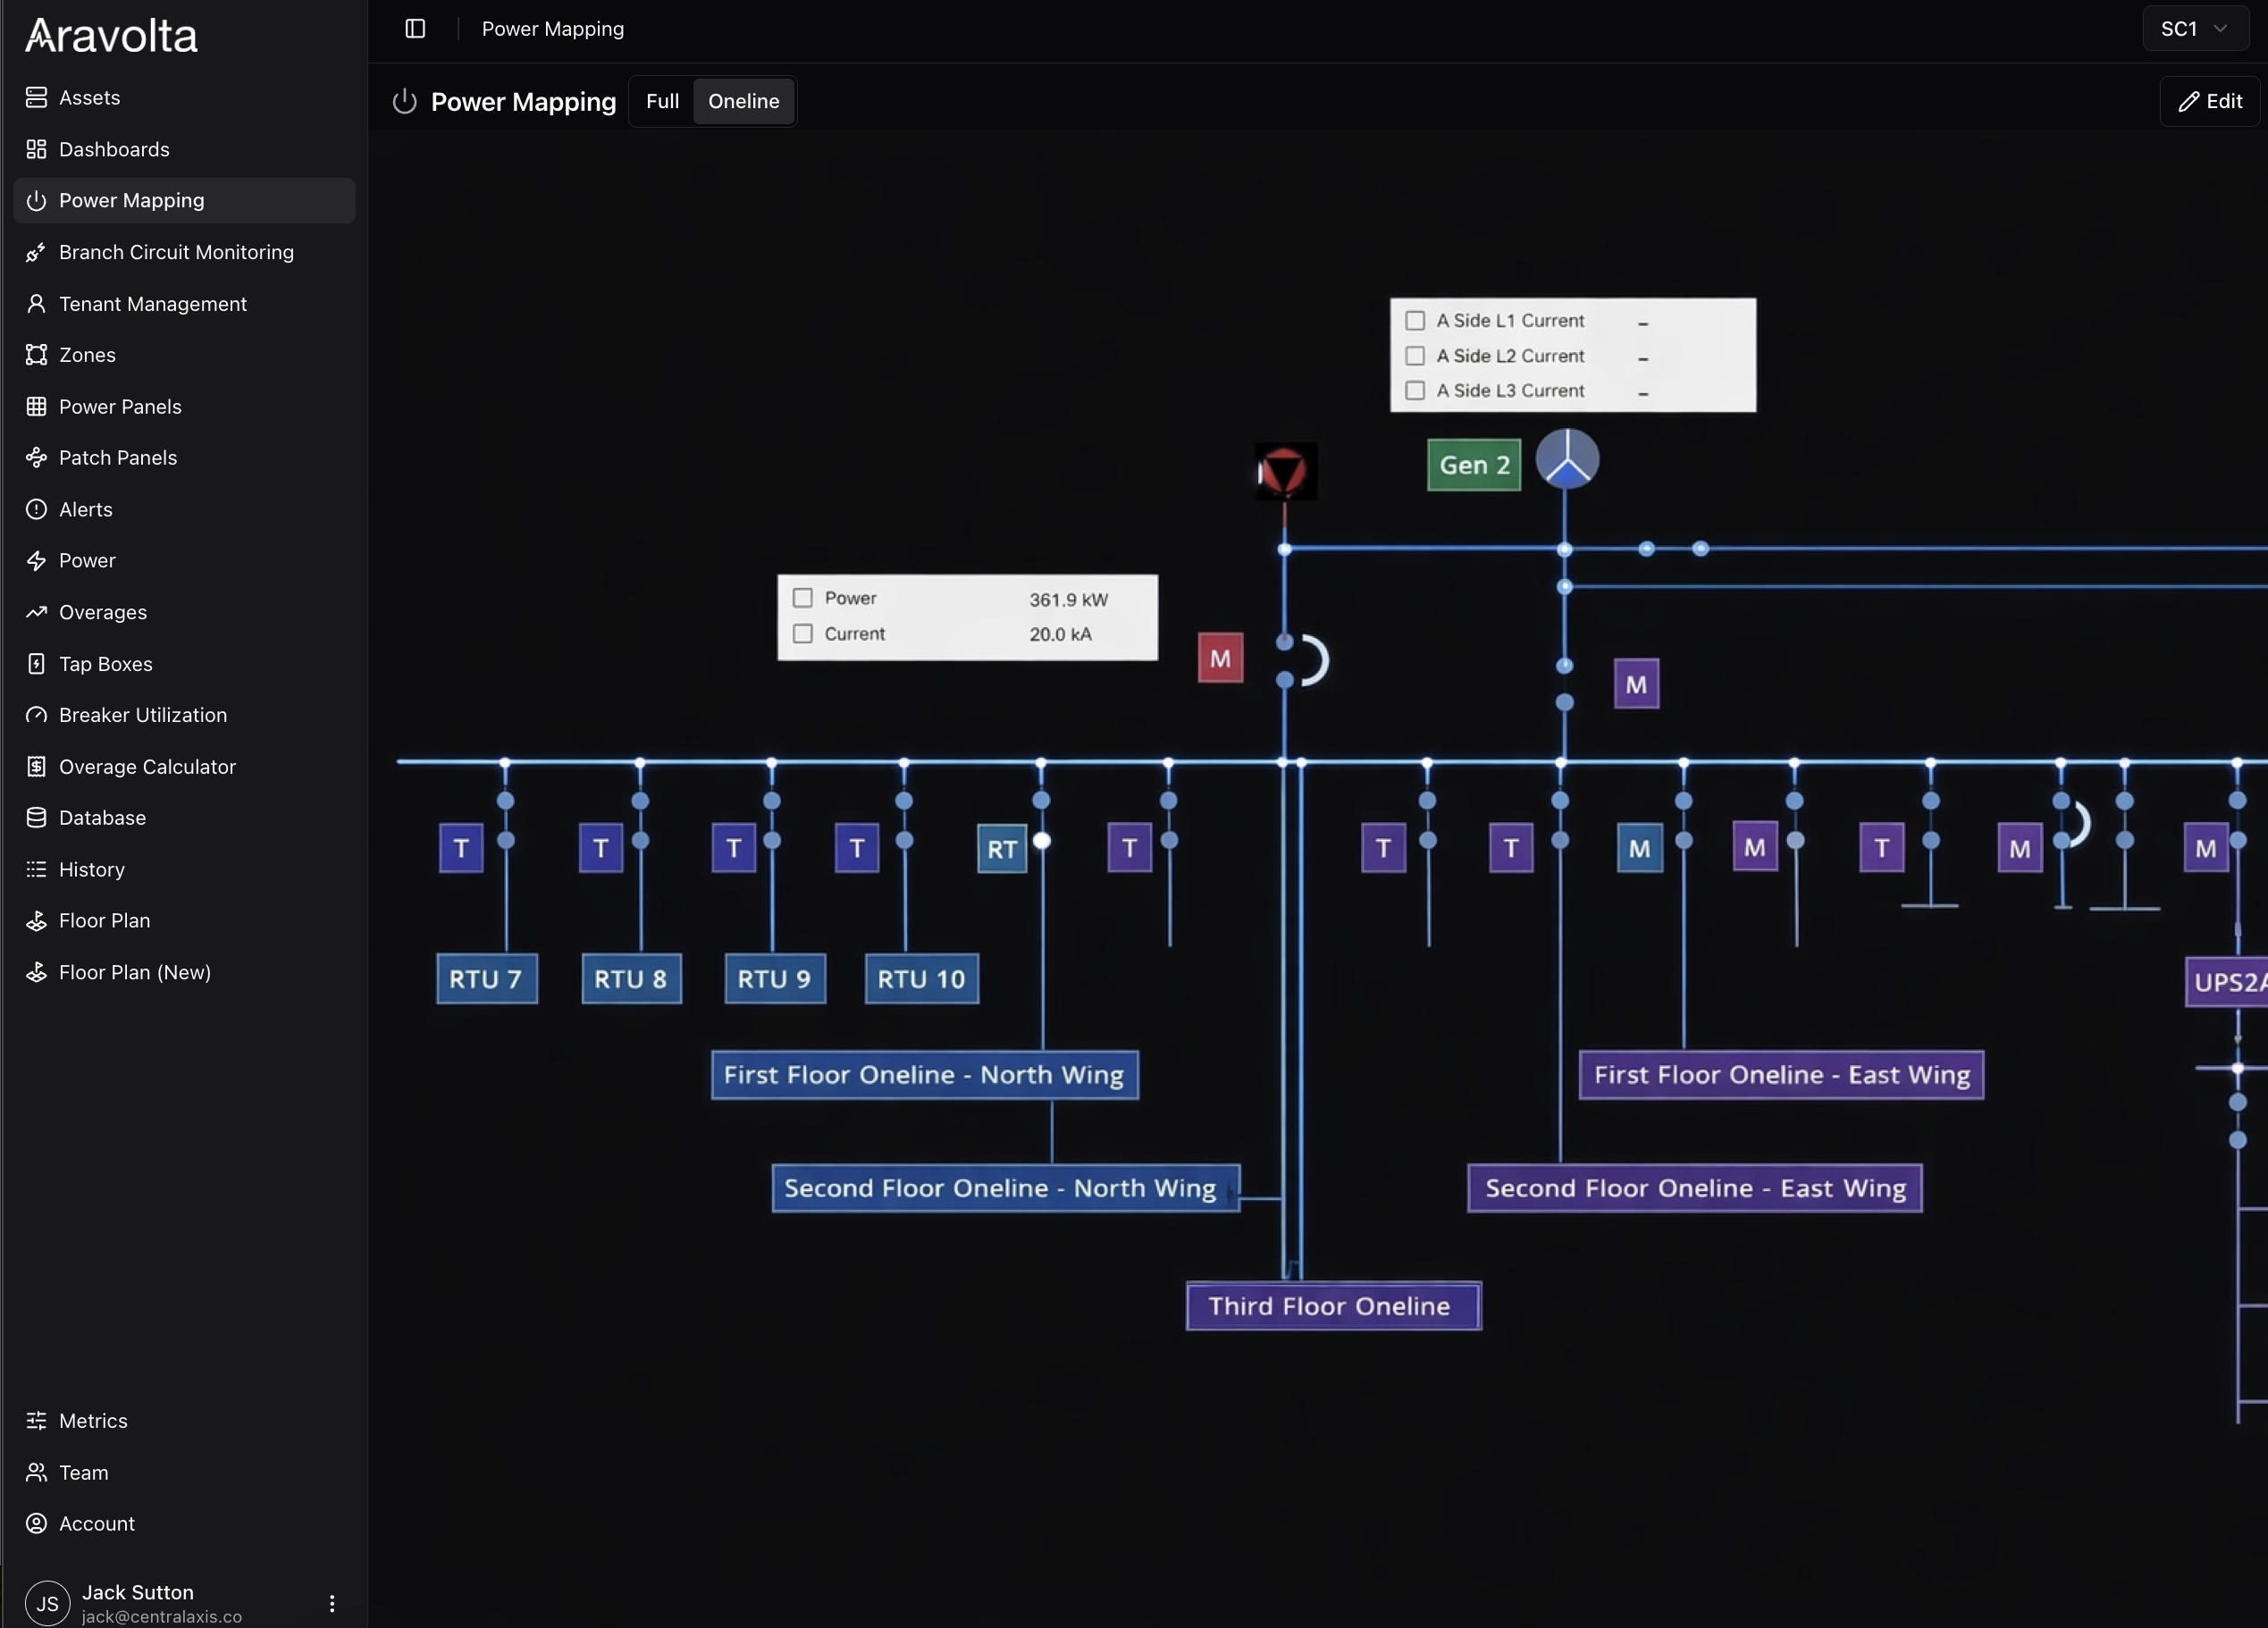
Power flow mapping from transformer to rack, with real-time status and load data
What you see in the platform
Every layer of your electrical infrastructure, from utility feed to rack outlet.
One-line diagrams
Interactive single-line diagrams that map your full power path from utility intake through switchgear, ATS, UPS, PDUs, and down to individual breakers. Click any node to see live voltage, current, load, and status.
Branch circuit monitoring
Per-breaker visibility across every panel. See load per circuit, identify stranded capacity, and get alerts before a breaker trips. Track individual tenant or rack-level consumption.
Breaker and transfer tracking
Real-time breaker status across every panel and RPP. ATS transfer events logged with timestamps. UPS bypass events, generator starts, and source quality all tracked and alerted.
Metered tenant billing
Outlet-level and circuit-level metering feeds directly into billing. No spreadsheets, no estimates. Power usage per tenant, per rack, per circuit, exportable and API-accessible.
Live in weeks, not months
Traditional EPMS deployments take six months of point mapping, register configuration, and MIB wrangling. Aravolta automates all of it.
Install the node
One hardware node per site, plugged into your network. Two minutes of physical setup. No rack-by-rack wiring, no serial daisy chains.
Auto-discovery
The node finds every networked meter, PDU, UPS, and panel on its own. No manual point mapping. No MIB files. No Modbus register spreadsheets. You give us credentials. We handle the rest.
Live in ~2 weeks
Full power chain mapped, alerts configured, dashboards populated. New device comes online later? We detect it automatically, or you add it and we build the template within 48 hours.
No per-point pricing
We don't charge per data point. Every metric your equipment reports gets ingested: voltage, current, power factor, harmonics, battery health, all of it. No decisions about which points are "worth" monitoring. If the device reports it, you get it.
Capacity planning and trending
See actual headroom at every level of the power chain: switchgear, UPS, PDU, panel, circuit. Historical trending shows load growth over time so you know when you'll need to add capacity, not after you've run out.
Custom formulas let you track PUE, cost-per-kW, efficiency ratios, or any derived metric across your equipment. Full REST API for feeding data into your portal, billing system, or tenant dashboards.
Protocol support
Works with any metering device on your network.
Why not standalone EPMS?
Eaton Foreseer, Siemens WinPM.net, Schneider PowerLogic: they give you power data in isolation. Your cooling data is somewhere else. Your asset data is somewhere else. And every one of them takes months to deploy.
Aravolta puts power alongside cooling, assets, and capacity in one platform. When a breaker trips, you see the thermal impact and affected tenants in the same view. And it's live in weeks, not quarters.
Frequently Asked Questions
Everything you need to know about Aravolta's EPMS, from deployment to integration.
What is an Electrical Power Management System (EPMS)?
An EPMS is a platform that monitors electrical power from utility intake through switchgear, UPS, PDUs, and down to individual circuits and outlets. Aravolta's EPMS provides real-time visibility with sub-second polling, interactive one-line diagrams, and comprehensive metering across your entire power chain.
How does Aravolta's EPMS differ from standalone systems like Eaton Foreseer or Schneider PowerLogic?
Standalone EPMS solutions deliver power data in isolation, requiring months to deploy. Aravolta integrates power monitoring alongside cooling, asset management, and capacity planning in a single platform. When a breaker trips, you see thermal impact and affected tenants in one view.
What does branch circuit monitoring include?
Branch circuit monitoring provides per-breaker visibility across every electrical panel. Track load per circuit, identify stranded capacity, receive alerts before overload, and monitor individual tenant or rack-level consumption at the circuit level.
What protocols does the EPMS support?
Aravolta's EPMS supports Modbus TCP, Modbus RTU, BACnet IP, OPC-UA, LON, SNMP, and IPMI. Custom drivers are available for vendor-specific protocols. No per-device licensing. All discovered meters report all available data.
How fast can the EPMS be deployed?
Deployment takes approximately two weeks from hardware installation to live monitoring. The node performs auto-discovery of all networked meters, PDUs, UPS systems, and panels without manual point mapping or MIB file configuration.
Can EPMS data be used for tenant billing?
Yes. Aravolta's EPMS includes metered tenant billing capabilities at outlet and circuit levels. Power usage data feeds directly into your billing system via REST API. No spreadsheets, no estimates, with full auditability and exportability.
How does EPMS integrate with DCIM and BMS?
Aravolta's EPMS sits within a unified DCIM platform alongside cooling, asset, and capacity management. Power chain data correlates with thermal maps and BMS integration points. REST API enables bidirectional integration with third-party systems.
What is a power chain diagram?
A power chain diagram is an interactive single-line diagram mapping your complete electrical path from utility intake through switchgear, ATS, UPS, PDUs, and to individual breakers. Click any node to see live voltage, current, load, and status.
See your full power chain
One-line diagrams, branch circuit monitoring, breaker tracking, and metered billing. Live in weeks.
- Sub-second polling
- Vendor-agnostic
- Live in ~2 weeks