
Every system. Every site. One command center.
Monitor and control your generators, chillers, switchgear, UPS, and cooling plant from a single browser tab. Aravolta SCADA sits on top of your BMS and EPMS and gives your operators one screen for everything.
SCADA command center: generators, chillers, switchgear, and cooling plant in one view
Where SCADA sits
SCADA is the supervisory layer that aggregates BMS, EPMS, fire, security, and generators into one operator interface.
SCADA / HMI
Operator dashboards, alarms, control actions, historian
BMS
Cooling, HVAC, environmental, fire
EPMS
Power distribution, metering, UPS
Field Devices
Sensors, PLCs, RTUs, meters, IoT endpoints, CT clamps, analog inputs
What you control from one screen
Every mechanical, electrical, and environmental system in your facility. Monitor, alert, and take action without switching tools.
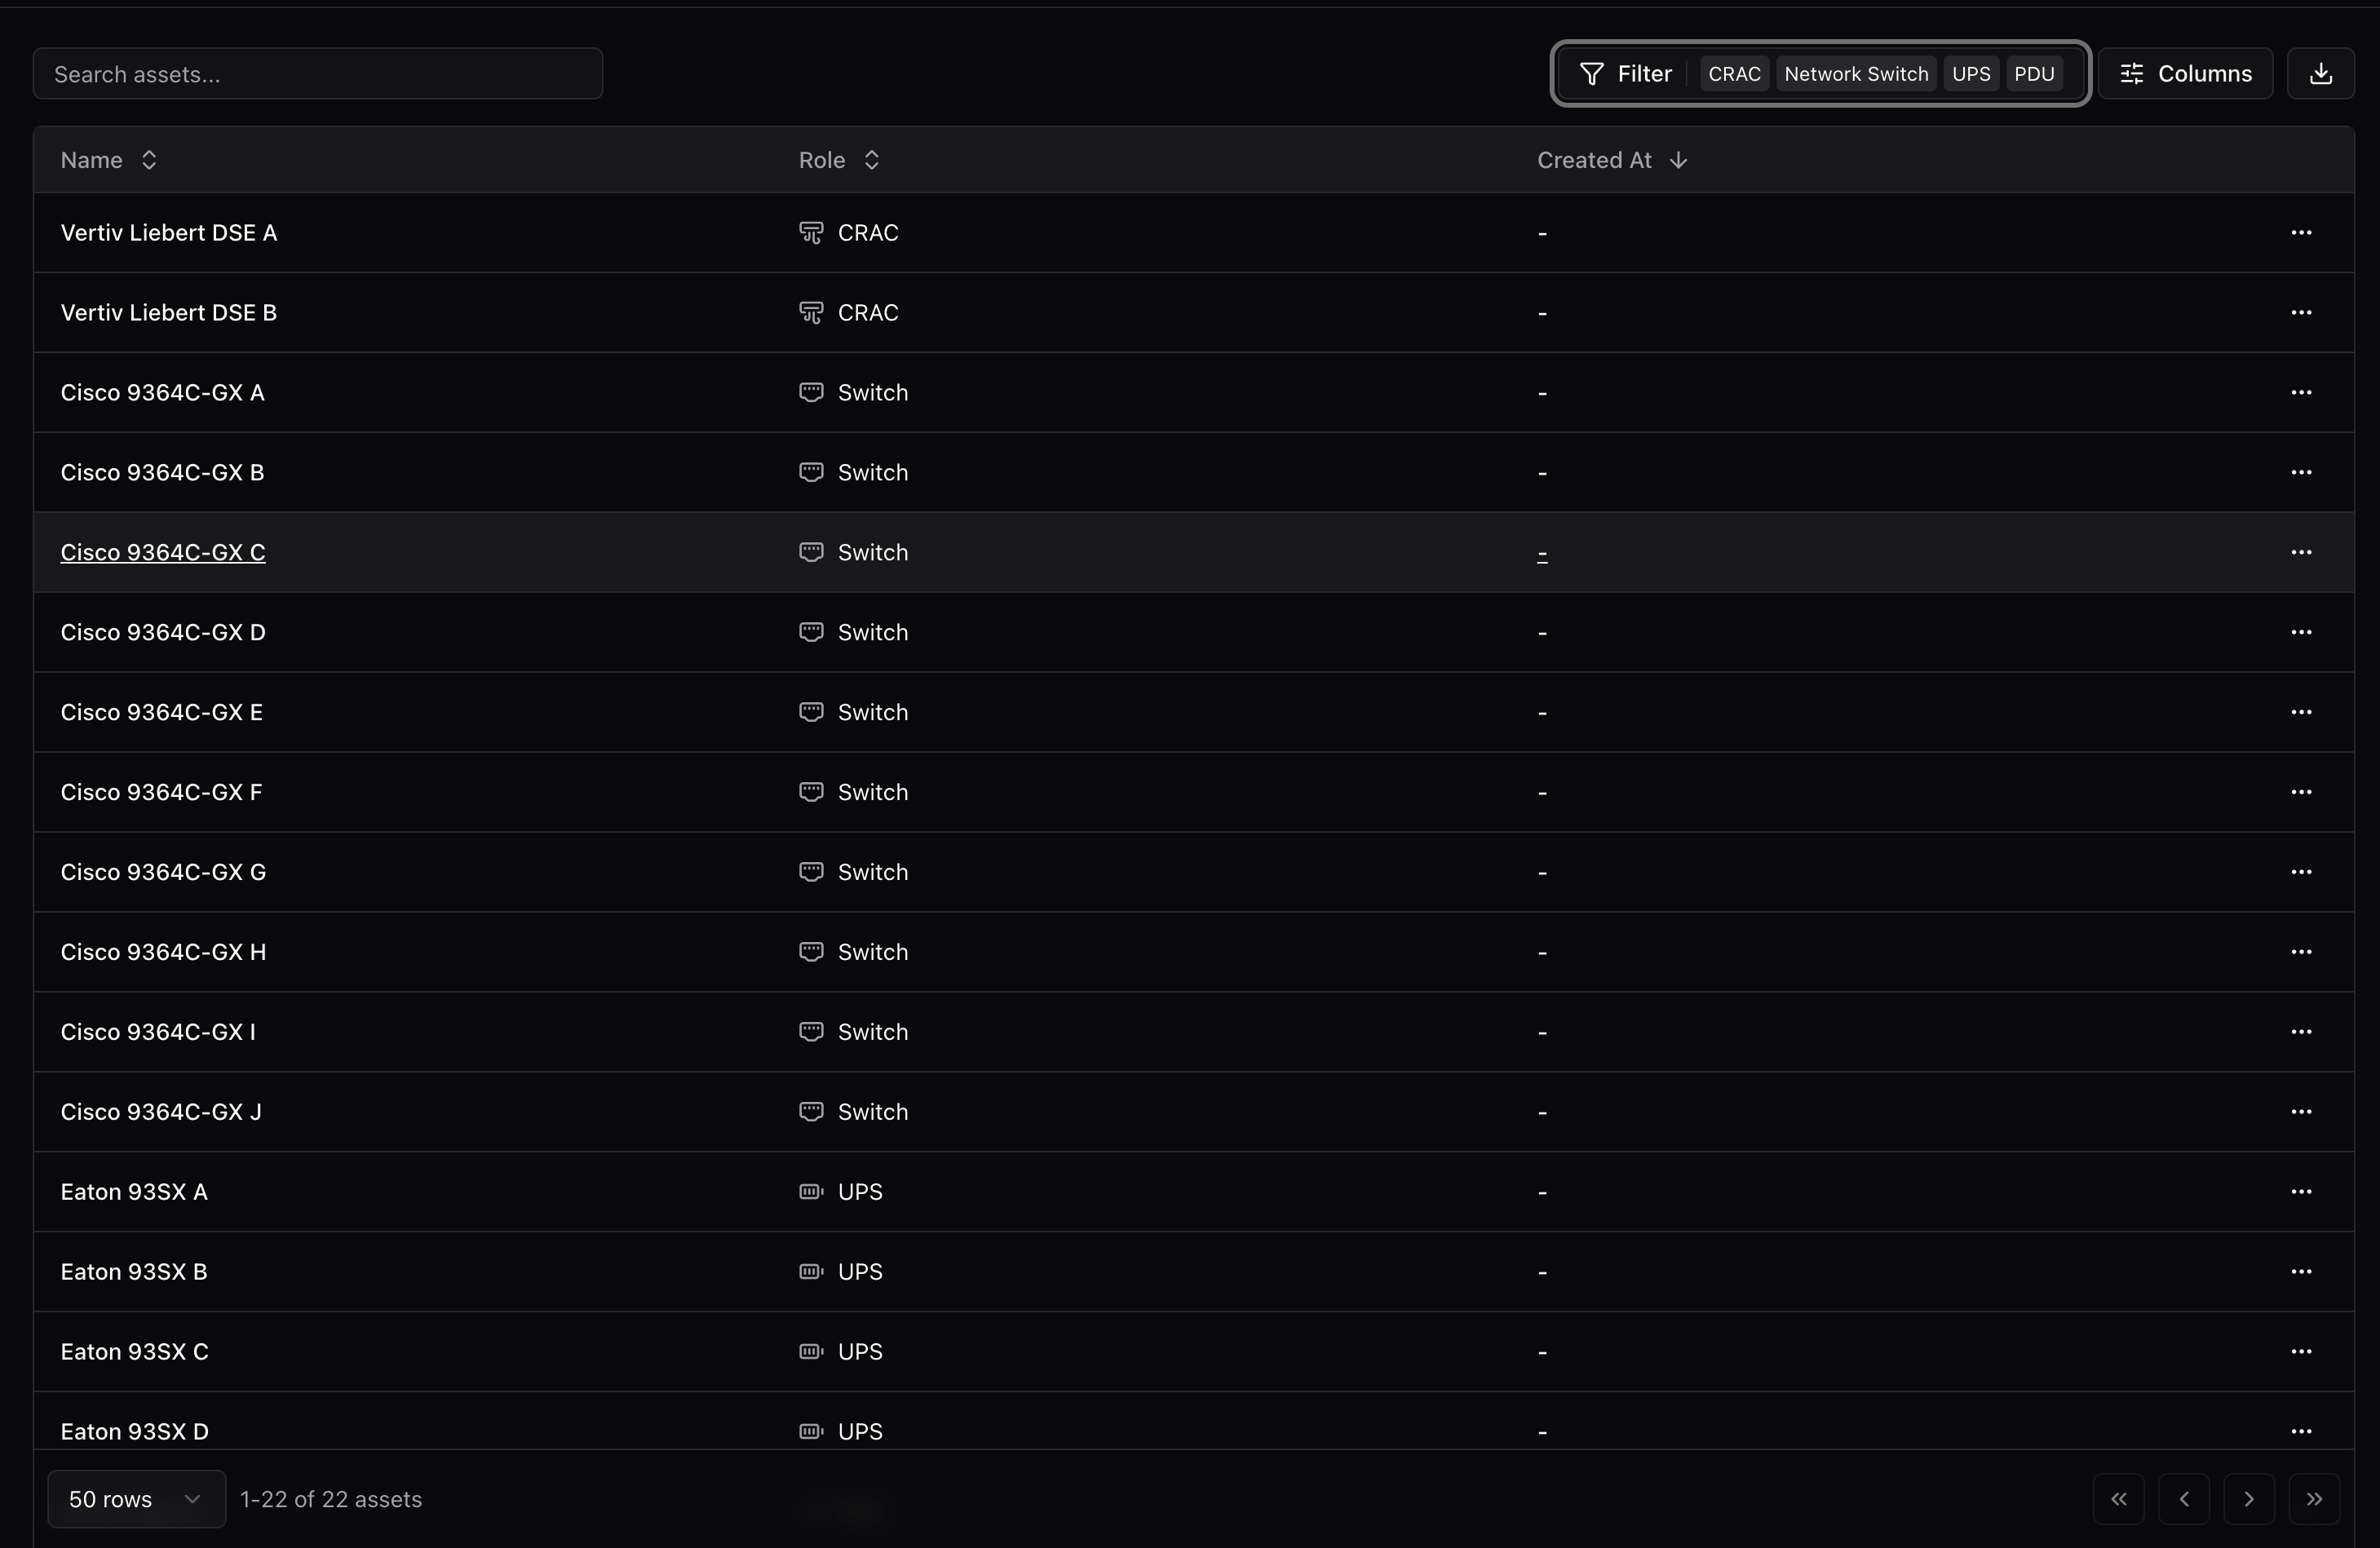
Unified HMI dashboards
Floor plans, system schematics, and live data overlays from any browser. Build custom views with drag-and-drop or use built-in templates. No dedicated SCADA workstations. No VPN required.
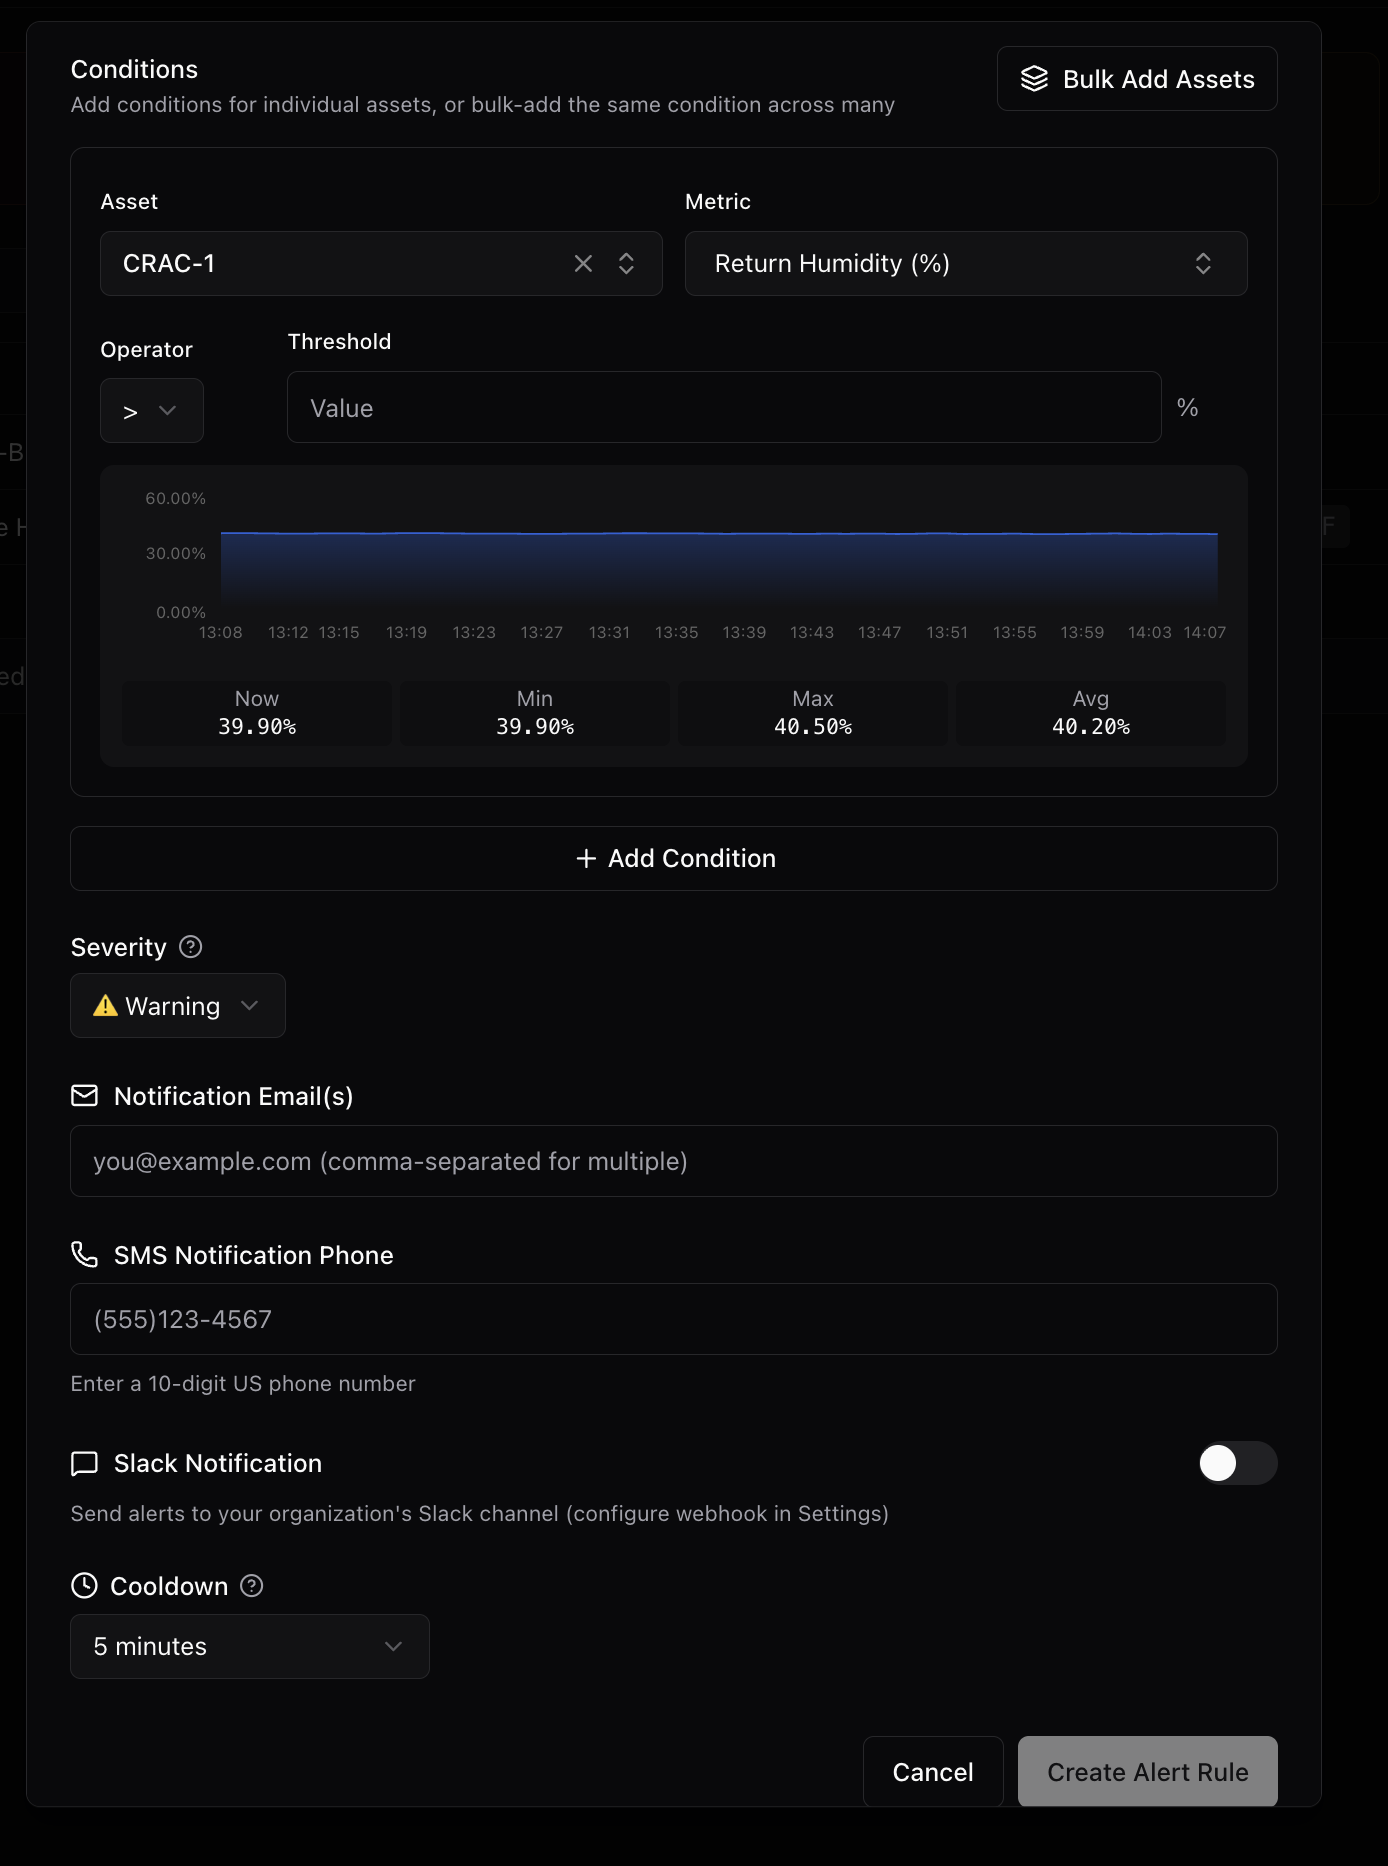
Cross-system alarm management
Conditional rules that span systems: 'if UPS load exceeds 80% AND chiller output drops.' Built-in cooldown and dedup logic to prevent alert storms. Routes to Slack, email, SMS, PagerDuty.
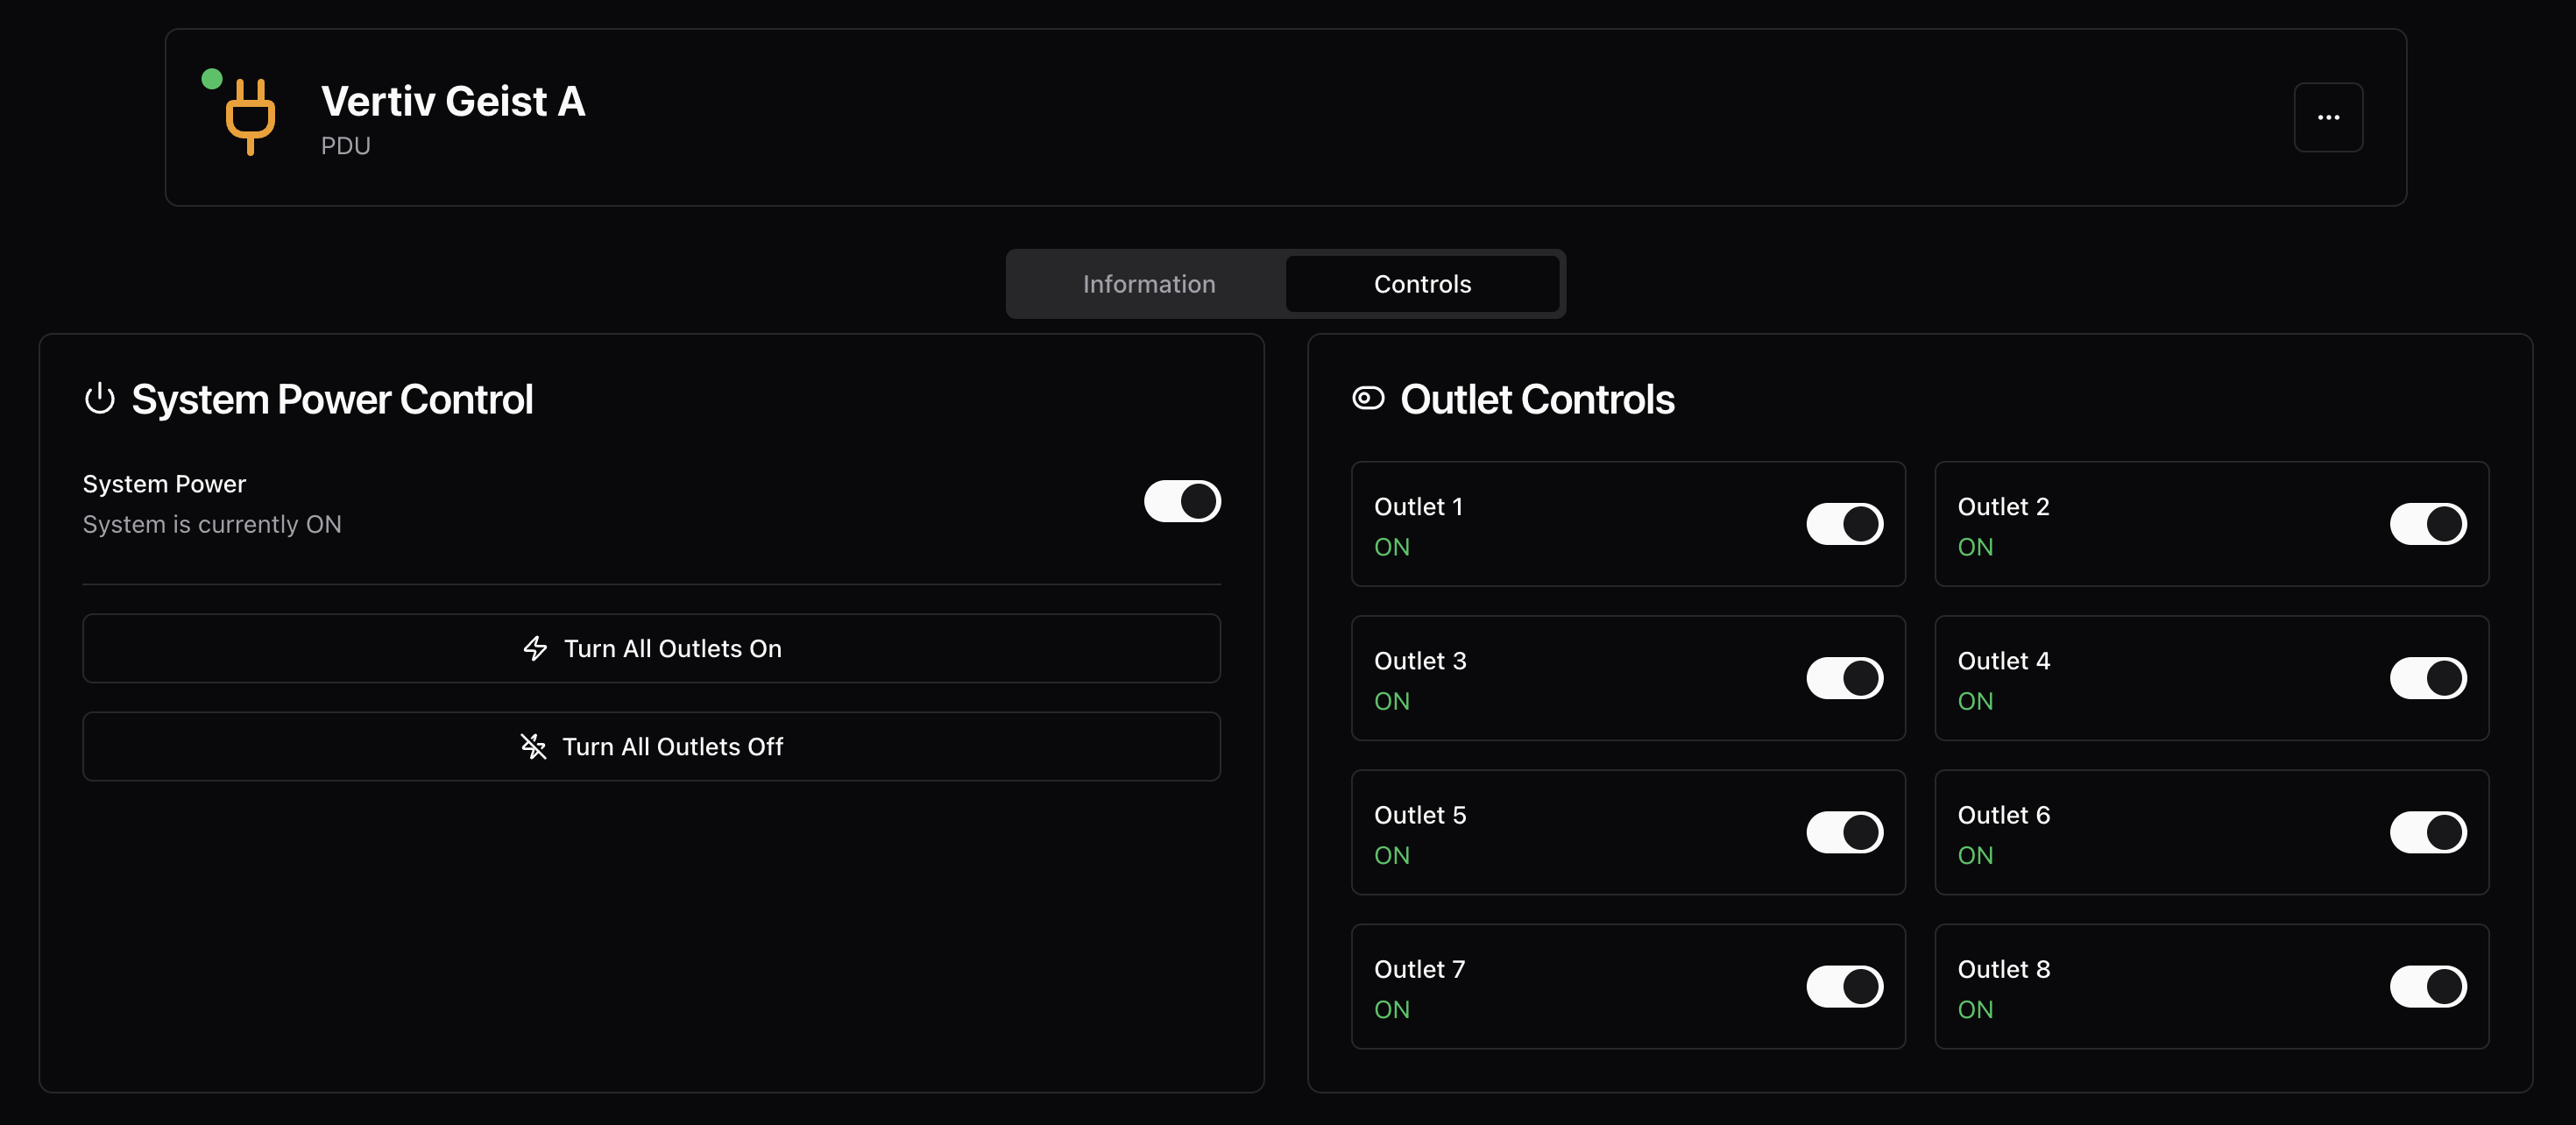
Remote control
Start and stop generators, adjust cooling setpoints, switch power paths, toggle breakers. Role-based access so not everyone can touch critical systems. Full audit log of every control action.
Historian and trend analysis
Every data point stored at configurable resolution. Overlay trends across systems. Correlate cooling output with power consumption with server load. Compliance-ready export for audits.
Alarms that mean something
A humidity sensor drifting 2% is not the same as a UPS on battery. Aravolta SCADA correlates alerts across systems so your operators see context, not noise.
Built-in cooldown logic prevents 500 alerts from a single chiller failure. Conditional rules span multiple assets and zones. Your NOC team sees the root cause, not the symptoms.
Control, not just monitoring
Most DCIM tools show you data. Aravolta SCADA lets you act on it. Start generators, adjust cooling setpoints, switch power paths, toggle breakers. All from the browser.
Role-based access control means your facility ops team can adjust setpoints while restricting who can touch generators. Every action is logged with timestamp, user, and before/after values.
Live in weeks, not months
Traditional SCADA deployments require proprietary hardware, specialist integrators, and months of configuration. Aravolta automates all of it.
Install the node
One hardware node per site. Connects to your BMS, EPMS, and field devices over BACnet, Modbus, OPC-UA, and SNMP. No rack-by-rack wiring.
Auto-discovery
The node finds every device on the network: generators, chillers, switchgear, meters, sensors. 25,000+ pre-built templates applied automatically. You provide credentials. We handle the rest.
Live in ~2 weeks
Full SCADA command center operational. Dashboards, alarms, control sequences, and historian configured. New equipment added later is detected automatically or onboarded within 48 hours.
No per-point pricing
We don't charge per data point. Every metric your equipment reports gets ingested: temperatures, pressures, flow rates, voltages, generator status, all of it. No decisions about which points are "worth" monitoring. If the device reports it, you get it.
Protocol support
Speaks every protocol your field devices use.
Also supports CT clamps, RS-485/RS-232, Form C dry contacts, and 4-20mA / 0-10V analog inputs for non-networked equipment.
Why not traditional SCADA?
- Proprietary hardware
- Per-point licensing
- Manual point mapping
- Siloed from DCIM and billing
- 6+ months to deploy
- Web-based, any browser
- All points, flat rate
- Automated onboarding
- Unified with BMS, EPMS, DCIM
- ~2 weeks to deploy
Your facility deserves a real command center
Monitor and control every system from one browser tab. No proprietary hardware. No specialist integrators. Live in weeks.
- Sub-second data refresh
- Vendor-agnostic
- Live in ~2 weeks